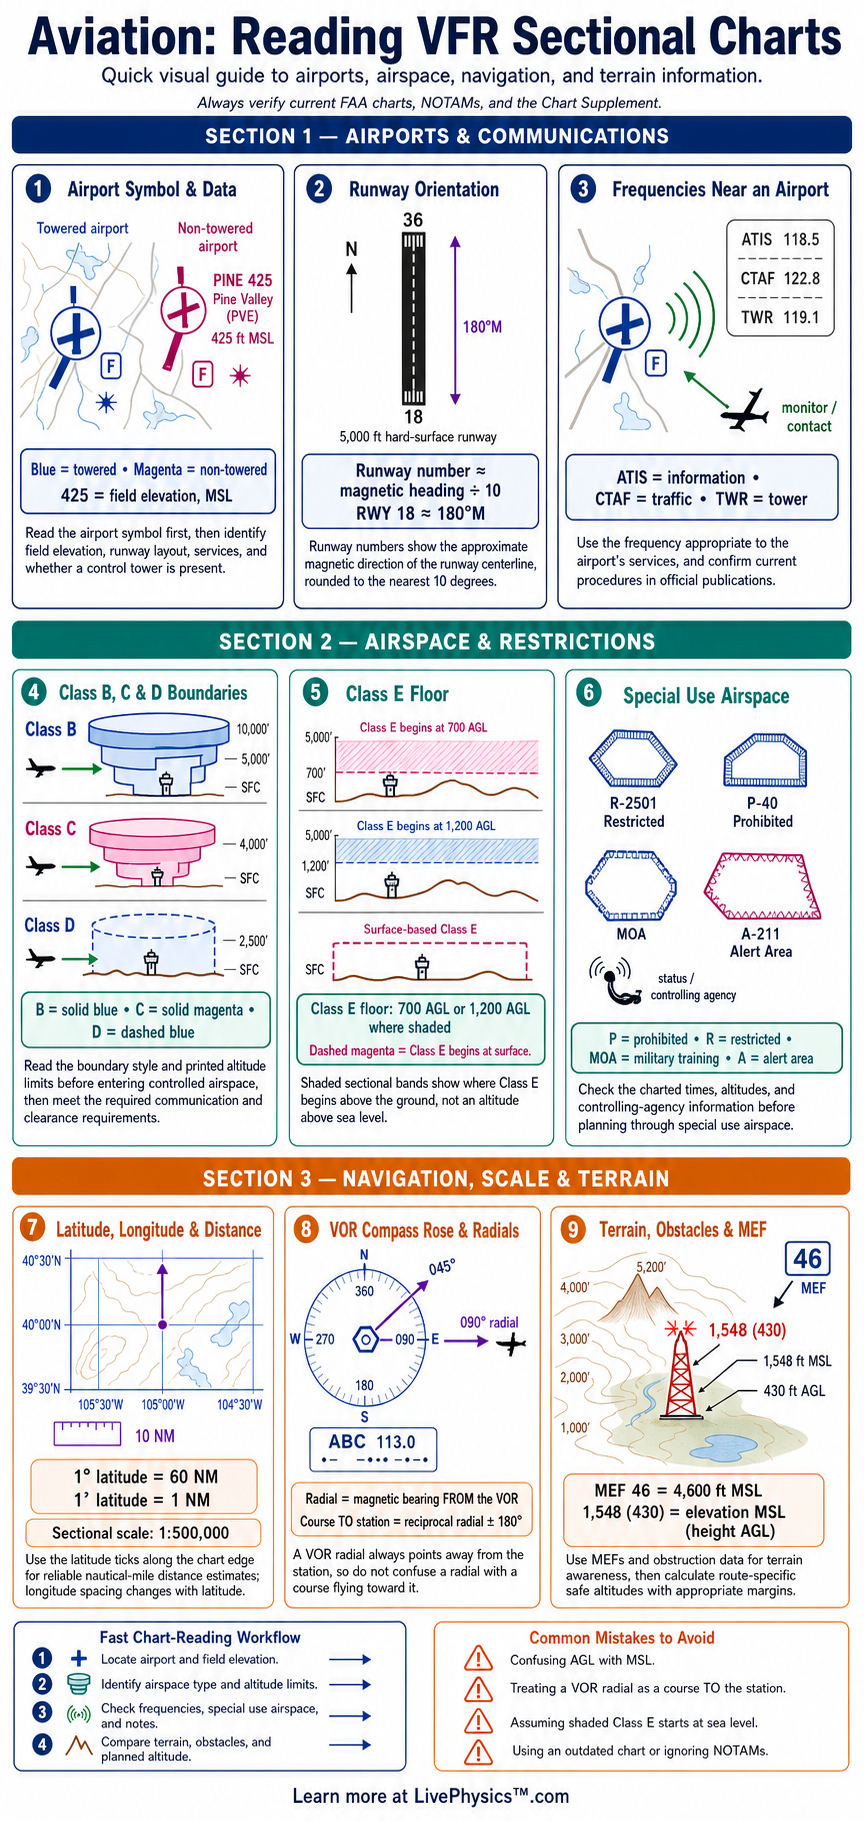
VFR sectional charts give pilots a detailed picture of the airspace, terrain, airports, navigation aids, and hazards along a route. Students use them to plan safe visual flights and to understand what they see outside the aircraft. This cheat sheet organizes the most important chart features into a fast reference for study and flight planning.
A sectional chart uses colors, symbols, labels, and contour lines to communicate large amounts of information in a small space. Blue and magenta markings often identify controlled airspace and airport information. Brown markings show terrain, while blue features commonly show water and VOR navigation aids.
Accurate chart reading requires students to connect every symbol with its meaning, altitude, and operating requirement.
Key Facts
- A VFR sectional chart has a scale of one to 500,000, so one inch on the chart equals about 6.86 nautical miles on the ground.
- A solid blue boundary marks Class B airspace, and a solid magenta boundary marks Class C airspace.
- A dashed blue boundary usually marks Class D airspace, while a dashed magenta boundary marks Class E airspace that begins at the surface.
- A magenta shaded band indicates Class E airspace beginning at 700 feet above ground level, and a blue shaded band indicates Class E beginning at 1,200 feet above ground level.
- Brown contour lines connect points of equal elevation, and the printed contour number gives elevation in feet mean sea level.
- A maximum elevation figure gives the highest known elevation of terrain or obstacles within its chart quadrangle, measured in feet mean sea level.
- A blue compass rose identifies a VOR, and each radial is a magnetic bearing extending outward from the VOR station.
- To convert true course to magnetic course, add west variation or subtract east variation.
Vocabulary
- Sectional chart
- Aeronautical map used primarily for visual flight planning and navigation.
- Radial
- A magnetic bearing that extends outward from a VOR navigation facility.
- Maximum elevation figure
- The highest known terrain or obstacle elevation in a chart quadrangle, shown in feet mean sea level.
- Mean sea level
- A standard elevation reference based on the average height of the sea surface.
- Class E airspace
- Controlled airspace that commonly begins at the surface, 700 feet, 1,200 feet, or 14,500 feet above ground level.
- Common traffic advisory frequency
- A radio frequency pilots use to announce and coordinate traffic at many non-towered airports.
Common Mistakes to Avoid
- Confusing a VOR radial with a bearing to the station is wrong because radials always point outward from the VOR. A bearing to the station is the reciprocal of the radial.
- Reading obstacle elevation as height above the ground is wrong because sectional obstacle figures are generally given in feet mean sea level. Compare the figure with the planned altitude using the same reference.
- Assuming every magenta airport symbol has a control tower is wrong because magenta normally identifies a non-towered airport. Blue airport symbols generally indicate towered airports.
- Ignoring airspace altitude labels is wrong because a boundary alone does not show the full vertical limits. Read each shelf label to determine the floor and ceiling.
- Using an expired sectional chart is wrong because airspace, frequencies, obstacles, and airport information can change. Verify the edition date and current notices before flight.
Practice Questions
- 1 A route measures 4.5 inches on a sectional chart. Calculate the approximate route distance in nautical miles using 6.86 nautical miles per inch.
- 2 A maximum elevation figure along a route is 5,400 feet mean sea level. Determine whether a planned altitude of 5,000 feet mean sea level provides terrain clearance.
- 3 A VOR radial is labeled 090 degrees. State the magnetic bearing from the VOR and the magnetic bearing toward the VOR.
- 4 Explain why a pilot must examine both the color of an airspace boundary and its printed altitude labels before entering the area.
Understanding Reading VFR Sectional Charts
A VFR sectional chart is a map designed for visual flight rules operations. It covers a large area at a scale of one to 500,000. This means one inch on the chart represents about 6.86 nautical miles on the ground.
Pilots use the chart before flight to select checkpoints, measure distance, identify airspace, and locate alternate airports. During flight, it helps them compare visible landmarks with the planned route. A chart is only useful when it is current, so pilots must check the chart edition date and current notices before relying on it.
Start by finding the planned route and reading the terrain along both sides of it. Brown contour lines connect points with equal elevation. Numbers near contours give elevations in feet mean sea level.
Maximum elevation figures give the highest known terrain or obstacle elevation within a chart quadrangle. These figures help pilots choose a cruising altitude with safe terrain clearance.
Obstacles such as towers appear in red and often include their top elevation. A pilot must compare obstacle heights with the aircraft altitude, not only with nearby airport elevations.
Airspace markings show where different operating rules apply. A solid blue boundary marks Class B airspace, and a solid magenta boundary marks Class C airspace. A dashed blue boundary usually marks Class D airspace around a towered airport.
Dashed magenta boundaries mark Class E airspace that begins at the surface. Magenta and blue shaded bands can show Class E airspace beginning at 700 feet or 1,200 feet above ground level.
Pilots must read the nearby altitude labels because airspace shelves can have different floors and ceilings. Entering certain airspace requires radio communication, clearance, equipment, or all of these.
Airport symbols provide quick information about airport services and control status. Blue airport symbols generally identify airports with an operating control tower, while magenta symbols identify airports without one. Runway shapes show hard-surfaced runways, and a small circle may indicate fuel services.
Frequencies near an airport identify communication channels such as tower, approach, automated weather, or common traffic advisory frequency. A flag symbol marks an airport with rotating beacon information. Students should always confirm airport details in the Chart Supplement because sectional symbols cannot show every operational detail.
Navigation aids support route planning and position awareness. A VOR is shown with a blue compass rose that gives magnetic bearings called radials. The number in the center identifies the VOR frequency, while the nearby identifier uses Morse code letters.
A pilot can plan to follow a selected radial or use intersections based on radials from two facilities. Longitude and latitude lines help identify coordinates, while the scale bar helps measure distance.
Good chart reading combines symbols with active navigation, weather information, and visual observation. It is a core skill because it turns a complex aviation map into practical decisions for a safe flight.