Practice distinguishing accuracy from precision, calculating percent error, and identifying sources of uncertainty in scientific measurements.
Read each problem carefully. Show your work for calculations, include units when needed, and explain your reasoning in complete sentences.
Evaluating measurements, calculations, and experimental reliability
Science - Grade 9-12
- 1
A student measures the mass of a standard 50.0 g object three times and records 49.8 g, 50.1 g, and 50.0 g. Describe the accuracy and precision of the measurements.
- 2
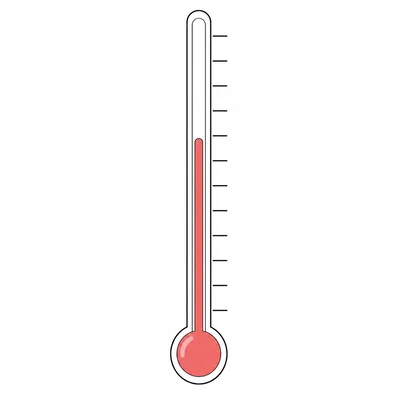
A thermometer reads 98.0 °C for boiling water when the accepted boiling point is 100.0 °C. Calculate the percent error.
- 3
Four students measure the length of the same table. Their results are 152.1 cm, 152.0 cm, 152.2 cm, and 152.1 cm. The true length is 155.0 cm. Are these measurements accurate, precise, both, or neither? Explain.
- 4
A student finds the density of a metal sample to be 7.62 g/cm³. The accepted density is 7.87 g/cm³. Calculate the percent error to the nearest tenth of a percent.
- 5
A group records the following times for one swing of a pendulum: 1.42 s, 1.41 s, 1.43 s, 1.42 s, and 1.41 s. The accepted period is 1.42 s. What do these data show about accuracy and precision?
- 6
A balance has a resolution of 0.01 g. A student records a sample mass as 12.34 g. What is a reasonable uncertainty for this measurement, and how should the mass be written with uncertainty?
- 7
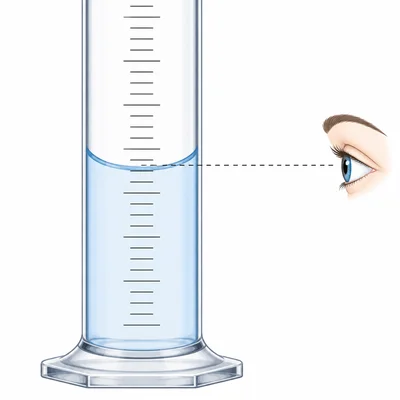
A graduated cylinder has markings every 1 mL. A student reads the bottom of the meniscus at 36.5 mL. Give one likely source of uncertainty and explain how it could affect the measurement.
- 8
An experiment gives these measured speeds for the same cart: 2.9 m/s, 3.4 m/s, 2.6 m/s, and 3.8 m/s. The accepted speed is 3.0 m/s. Describe the precision and explain what may have caused the pattern.
- 9
A student measures the acceleration due to gravity as 9.6 m/s². The accepted value is 9.8 m/s². Calculate the percent error.
- 10
A lab report states that a measured volume is 25.0 mL ± 0.5 mL. What is the range of possible values represented by this measurement?
- 11
A class uses a stopwatch to measure how long a ball takes to fall. The times are consistently about 0.20 s longer than expected. Identify whether this is likely random error or systematic error, and explain.
- 12
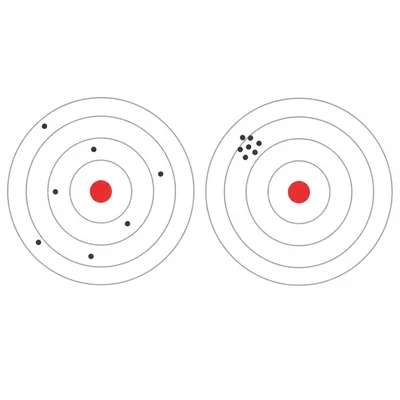
In a target analogy, Group A has shots scattered widely around the bullseye. Group B has shots tightly clustered far from the bullseye. Compare the accuracy and precision of the two groups.
- 13
A student reports a measured temperature as 21 °C using a thermometer marked every 1 °C. Another student reports 21.37 °C using the same thermometer. Which report is more appropriate, and why?
- 14
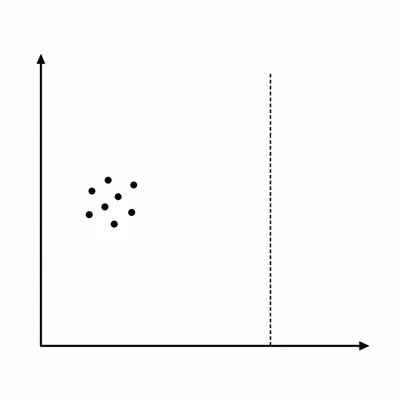
A graph of repeated mass measurements shows values clustered tightly near 18.0 g, while the accepted mass is 20.0 g. What conclusion should be made about the data, and what type of error might be present?
- 15
A student calculates the percent error for a measured wavelength. The experimental value is 510 nm and the accepted value is 500 nm. The student writes -2.0% because 500 - 510 = -10. Explain the mistake and give the correct percent error.