Practice planning, running, and interpreting climate model simulations using variables such as greenhouse gas concentration, albedo, solar input, and feedback effects.
Read each problem carefully. Use complete sentences and show calculations when needed. When interpreting model results, identify the variable changed, the outcome measured, and any limitations of the simulation.
Using simulations to test climate variables and interpret model results
Science - Grade 9-12
- 1
A simple climate model is run twice. In Run A, atmospheric carbon dioxide is set to 420 ppm. In Run B, carbon dioxide is set to 560 ppm, while all other settings remain the same. The model predicts a higher average global temperature in Run B. Identify the independent variable, the dependent variable, and one controlled variable in this simulation.
- 2
A climate simulation shows that global average temperature rises by 2.8 degrees Celsius after carbon dioxide is doubled from preindustrial levels. Explain what this result means and why it should not be treated as an exact prediction for a specific future year.
- 3
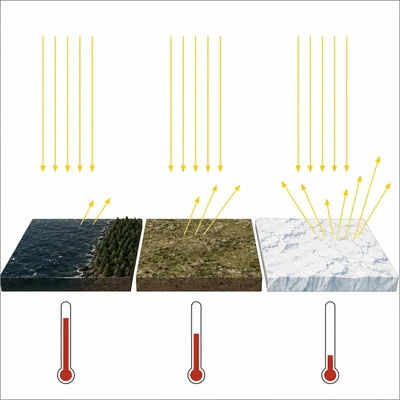
A student runs a climate model with three different surface albedo values: 0.20, 0.30, and 0.40. The predicted average temperatures are 18 degrees Celsius, 15 degrees Celsius, and 12 degrees Celsius. Describe the relationship shown by the simulation and explain the physical reason for it.
- 4

In a simulation, the model grid divides Earth into large boxes that are 100 kilometers wide. Explain one advantage and one limitation of using a grid in a climate model.
- 5
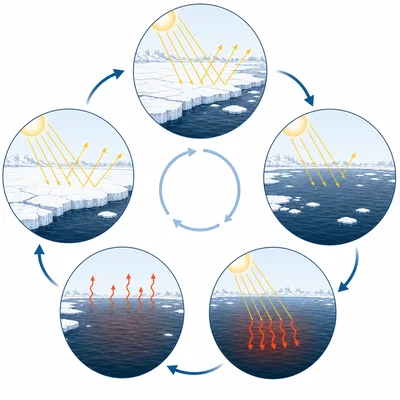
A model run includes a positive ice-albedo feedback. The simulation begins with warming that melts some sea ice. Explain how this feedback can amplify warming.
- 6

A researcher runs an ensemble of 30 climate simulations using slightly different starting conditions. The runs produce a range of possible temperatures for the year 2100 rather than one value. Explain why scientists use ensembles and what the range of results tells them.
- 7
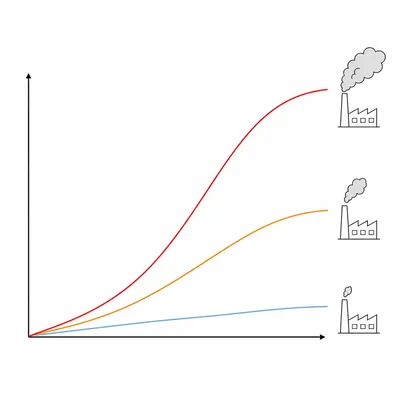
A climate model produces the following projected global temperature changes for 2100 under three emissions scenarios: low emissions, 1.4 degrees Celsius; medium emissions, 2.6 degrees Celsius; high emissions, 4.3 degrees Celsius. Explain what this comparison shows about the role of human choices in climate projections.
- 8
A student changes both carbon dioxide concentration and solar input at the same time in a climate model. The model temperature increases, but the student concludes that carbon dioxide caused all of the warming. Explain why this conclusion is not well supported and how the experiment should be improved.
- 9
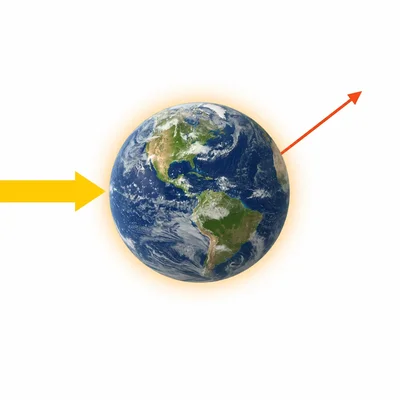
A model estimates Earth's energy balance. Incoming solar energy absorbed by Earth is 240 watts per square meter, and outgoing infrared radiation is 236 watts per square meter. Calculate the net energy imbalance and explain what it suggests about temperature change.
- 10
A climate simulation matches observed global temperature trends from 1980 to 2020 only when both greenhouse gases and aerosols are included. Explain what this suggests about model validation and the importance of including multiple climate forcings.
- 11
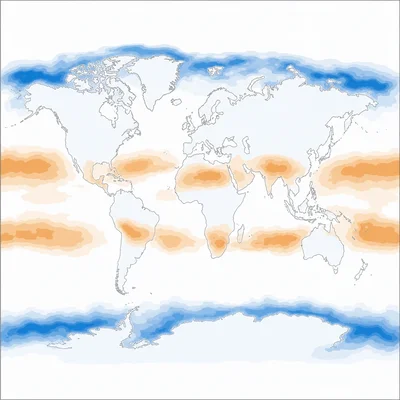
In one simulation, precipitation increases in high latitudes but decreases in some subtropical regions. Explain why a global climate model can predict different regional changes even when the global average temperature increases.
- 12
A policy group asks whether a climate model can prove exactly what the climate will be like in 2100. Write a short response explaining what climate models can and cannot do.