Practice interpreting scatter plots and linear regression models in scientific contexts, including identifying trends, reading equations, making predictions, and evaluating model limits.
Read each problem carefully. Use units when needed. Show your work in the space provided.
Using data trends, best-fit lines, slopes, and residuals in science investigations
Science - Grade 9-12
- 1
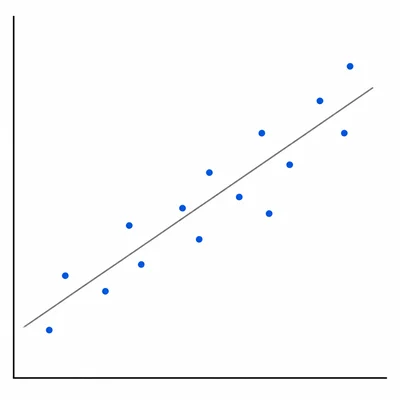
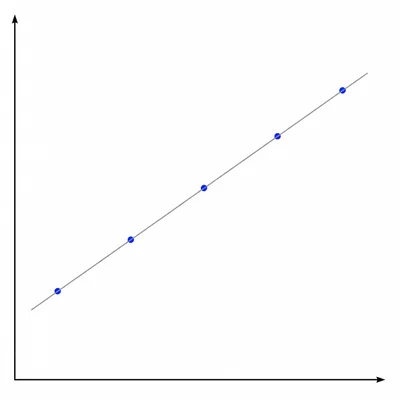
A biology class records plant height after different numbers of days under a grow light. The scatter plot shows that plant height generally increases as days increase. Describe the relationship between the variables and state whether the association is positive, negative, or no association.
- 2
A linear regression model for plant growth is h = 1.8d + 4.2, where h is plant height in centimeters and d is time in days. What does the slope 1.8 mean in this science context?
- 3
For the regression model T = -0.65a + 24, T is water temperature in degrees Celsius and a is altitude in hundreds of meters. Interpret the slope in context.
- 4
A chemistry group measures reaction rate at different temperatures. Their regression equation is r = 0.12T - 1.5, where r is reaction rate in moles per second and T is temperature in degrees Celsius. Predict the reaction rate at 30 degrees Celsius.
- 5
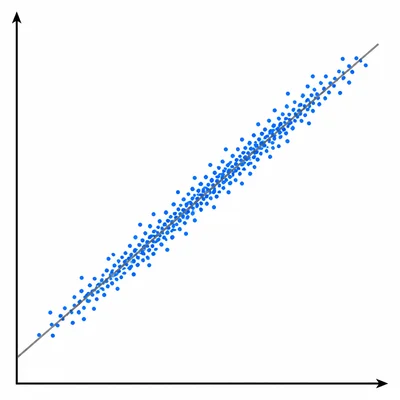
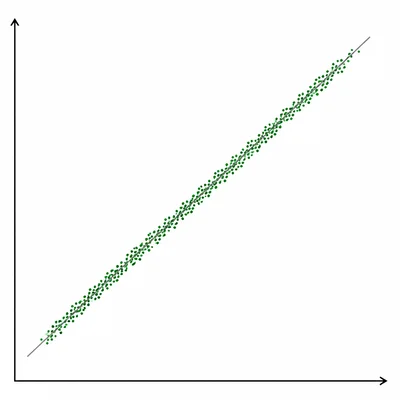
A scatter plot compares hours of sunlight per day with daily solar panel energy output. The points are closely clustered around an upward-sloping line. What can you conclude about the strength and direction of the relationship?
- 6
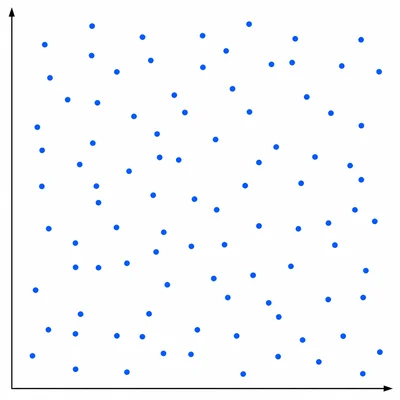
A student studies the relationship between shoe size and score on a biology test. The scatter plot has points spread randomly with no clear pattern. Is a linear regression model useful for prediction in this case? Explain.
- 7
A regression model for dissolved oxygen in a stream is O = -0.35T + 14.1, where O is dissolved oxygen in milligrams per liter and T is water temperature in degrees Celsius. Predict the dissolved oxygen when the water temperature is 20 degrees Celsius.
- 8
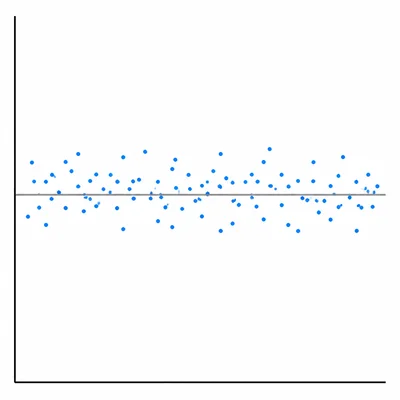
A scatter plot shows the relationship between the mass of a pendulum bob and the period of the pendulum. The points form a nearly horizontal cloud. What does this suggest about mass and period in this experiment?
- 9
A regression model predicts bacterial colony count as C = 52t + 120, where C is the number of colonies and t is time in hours. What is the y-intercept, and what does it mean in context?
- 10
A physics lab collects the following data for spring stretch: force in newtons: 1, 2, 3, 4, 5 and stretch in centimeters: 2.1, 4.0, 6.2, 7.9, 10.1. Describe the trend and estimate a reasonable linear regression equation.
- 11
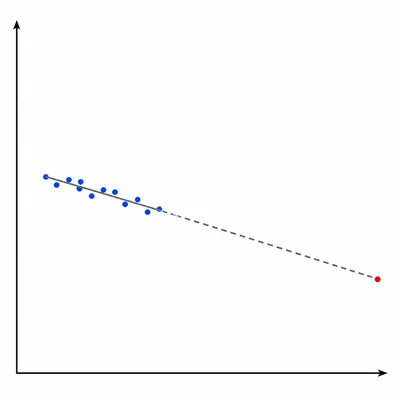
A student uses the model pH = -0.04c + 7.2, where c is carbon dioxide concentration in parts per million. The class measured concentrations only from 300 ppm to 600 ppm. Is it appropriate to use this model to predict pH at 2000 ppm? Explain.
- 12
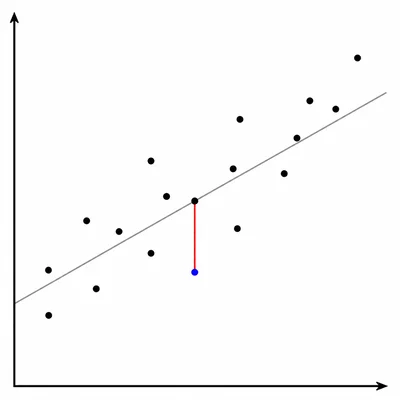
In an ecology study, a regression line predicts 18 bird species for a forest patch of 12 hectares. The actual observed number is 15 species. Calculate the residual and interpret it.
- 13
A scatter plot of air temperature versus cricket chirps per minute has a regression line with equation C = 4.5T - 80, where C is chirps per minute and T is temperature in degrees Celsius. The line fits the points fairly well. What temperature does the model predict when crickets chirp 55 times per minute?
- 14
A student reports that the correlation between fertilizer amount and plant biomass is r = 0.92. What does this value indicate about the relationship?
- 15
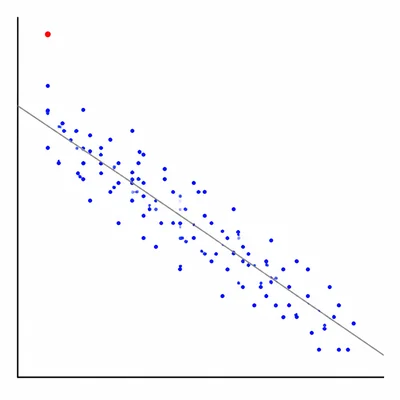
A scatter plot compares distance from a factory with lead concentration in soil. The regression line slopes downward, and one point close to the factory has much higher lead than the other points. Explain how this outlier could affect the regression line and the interpretation.