Practice reading scientific data tables, identifying patterns, and writing evidence-based conclusions.
Read each data table carefully. Use specific numbers from the data as evidence when you explain your conclusion.
Using patterns, comparisons, and evidence to support scientific claims
Science - Grade 9-12
- 1
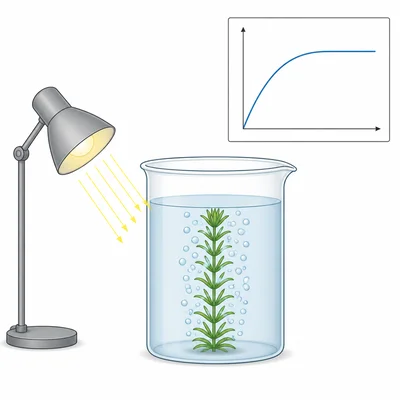
A student measured the rate of photosynthesis at different light intensities. Data: light intensity 100 lux, rate 4 bubbles per minute; 300 lux, rate 9 bubbles per minute; 500 lux, rate 14 bubbles per minute; 700 lux, rate 17 bubbles per minute; 900 lux, rate 18 bubbles per minute. Write an evidence-based conclusion about how light intensity affects photosynthesis.
- 2
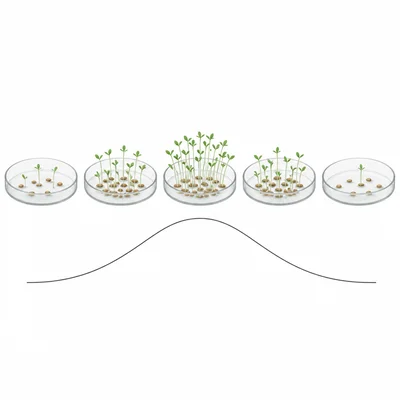
A class tested how soil pH affects seed germination. Data: pH 4.5, 22 percent germination; pH 5.5, 58 percent germination; pH 6.5, 86 percent germination; pH 7.5, 80 percent germination; pH 8.5, 49 percent germination. Which pH range appears best for germination, and what evidence supports your answer?
- 3
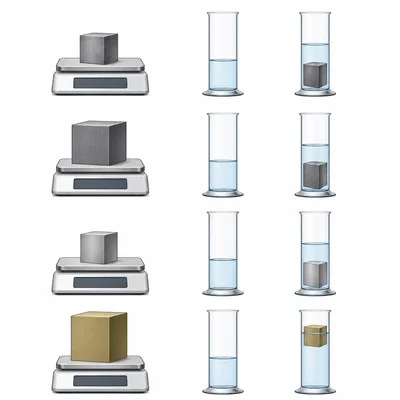
Four metal samples were measured to calculate density. Data: Sample A, mass 27 g, volume 10 mL; Sample B, mass 54 g, volume 20 mL; Sample C, mass 39 g, volume 15 mL; Sample D, mass 80 g, volume 40 mL. Which samples are likely made of the same material, and why?
- 4
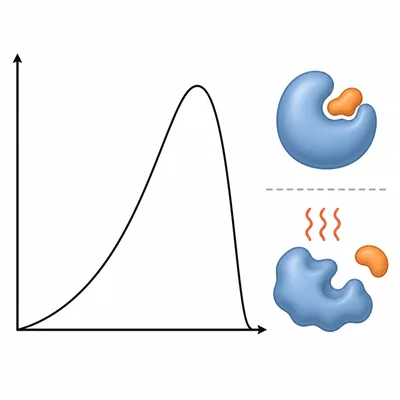
An enzyme experiment produced these results. Data: 10 degrees C, reaction rate 12 units per minute; 20 degrees C, 25 units per minute; 30 degrees C, 42 units per minute; 40 degrees C, 55 units per minute; 50 degrees C, 20 units per minute; 60 degrees C, 3 units per minute. Identify the enzyme's approximate optimal temperature and explain your reasoning.
- 5
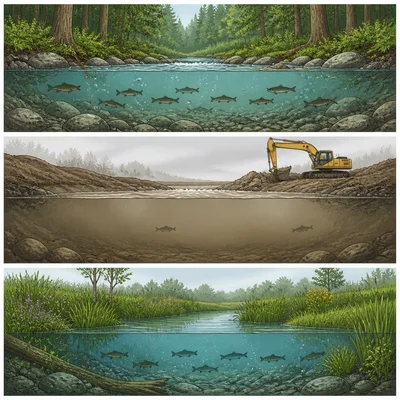
Scientists sampled three stream sites. Data: Site A, upstream forest, turbidity 5 NTU, dissolved oxygen 8.2 mg/L, fish species 12; Site B, near construction, turbidity 42 NTU, dissolved oxygen 5.1 mg/L, fish species 4; Site C, restored wetland, turbidity 11 NTU, dissolved oxygen 7.5 mg/L, fish species 10. Write a conclusion about water quality and fish diversity using evidence from the table.
- 6
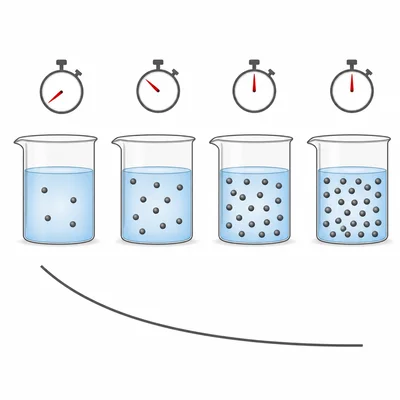
A reaction was tested at different reactant concentrations. Data: 0.10 M, average reaction time 120 seconds; 0.20 M, 61 seconds; 0.40 M, 30 seconds; 0.80 M, 15 seconds. Describe the relationship between concentration and reaction time.
- 7
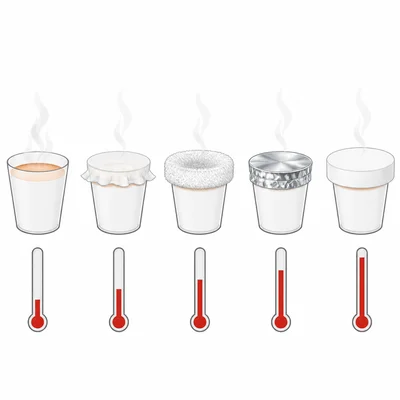
A student tested which cup covering reduced heat loss the most. All cups started at 70 degrees C. Data after 30 minutes: no covering, 42 degrees C; cotton cover, 51 degrees C; wool cover, 57 degrees C; aluminum foil cover, 53 degrees C; foam cover, 62 degrees C. Which covering was the best insulator, and what evidence supports this conclusion?
- 8
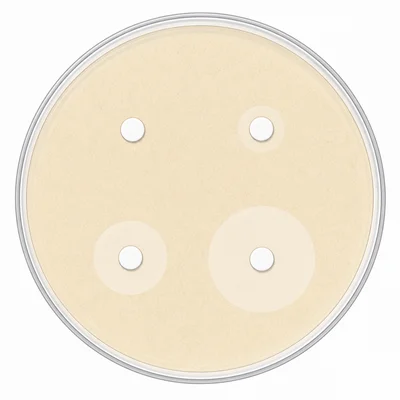
A microbiology class tested antibiotics against one strain of bacteria. Data: control disk, 0 mm zone of inhibition; penicillin, 2 mm; tetracycline, 18 mm; ciprofloxacin, 25 mm. Which antibiotic was most effective against this bacterial strain, and what limitation should be included in the conclusion?
- 9
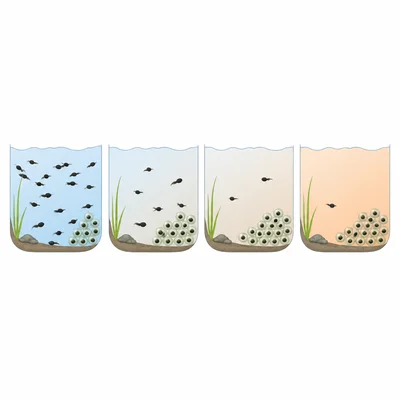
Researchers tracked lake pH and amphibian egg hatching success. Data: pH 6.8, 92 percent hatched; pH 6.1, 73 percent hatched; pH 5.6, 45 percent hatched; pH 5.0, 18 percent hatched. Write a conclusion that connects pH to hatching success.
- 10
A study recorded caffeine intake, sleep, and reaction time. Data: Group 1, 0 mg caffeine, 8 hours sleep, reaction time 260 ms; Group 2, 100 mg caffeine, 8 hours sleep, reaction time 245 ms; Group 3, 200 mg caffeine, 4 hours sleep, reaction time 310 ms; Group 4, 0 mg caffeine, 4 hours sleep, reaction time 355 ms. Explain why it would be too strong to conclude that caffeine always improves reaction time.
- 11
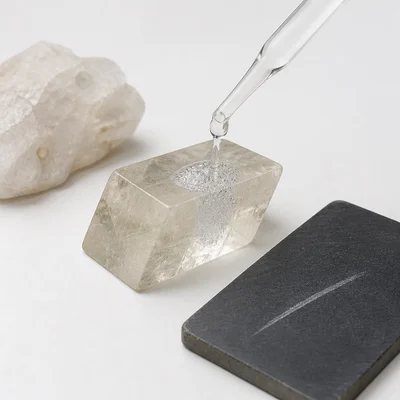
A student used a mineral identification table. Data: quartz, hardness 7, no reaction with acid; calcite, hardness 3, fizzes with acid; halite, hardness 2.5, salty taste and no acid fizz; unknown mineral, hardness 3, fizzes with acid. Which mineral is the unknown most likely to be, and what evidence supports the identification?
- 12
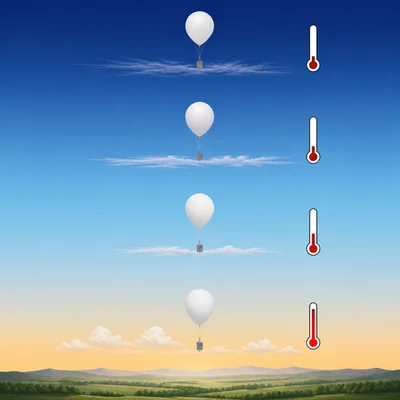
A weather balloon measured air temperature at different altitudes. Data: 0 m, 22 degrees C; 1000 m, 16 degrees C; 2000 m, 10 degrees C; 3000 m, 4 degrees C; 4000 m, -2 degrees C. Calculate the average temperature change per 1000 m and predict the temperature at 2500 m.
- 13
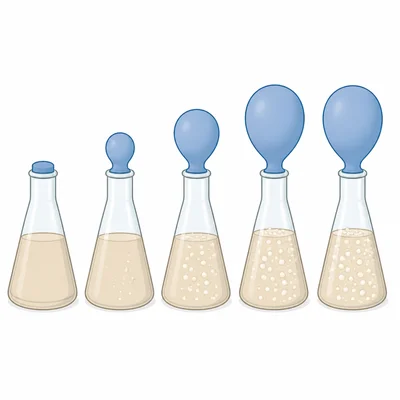
Yeast was grown with different glucose concentrations. Data: 0 percent glucose, CO2 production 1 mL per hour; 1 percent, 12 mL per hour; 2 percent, 23 mL per hour; 5 percent, 26 mL per hour; 10 percent, 25 mL per hour. What conclusion can be made about glucose concentration and yeast respiration?
- 14
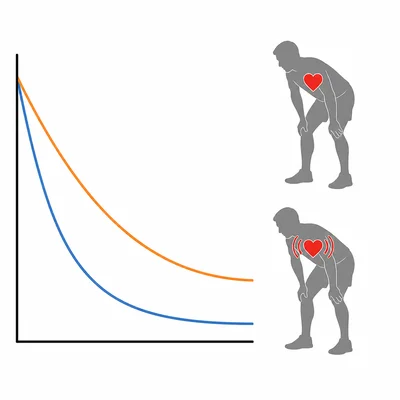
A biology class compared heart rate recovery after exercise. Data: trained athlete, resting heart rate 60 bpm, immediately after exercise 150 bpm, after 1 minute 110 bpm, after 3 minutes 72 bpm; non-athlete, resting heart rate 78 bpm, immediately after exercise 165 bpm, after 1 minute 145 bpm, after 3 minutes 112 bpm. Which person recovered faster, and what evidence supports your conclusion?
- 15
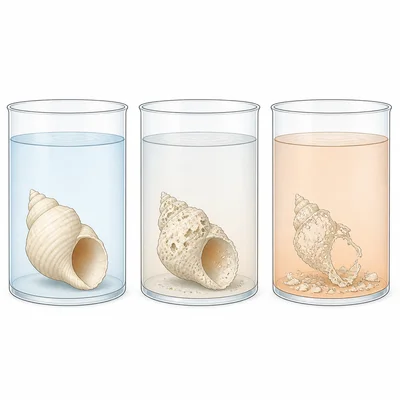
Marine snails were placed in seawater with different pH levels for one month. Data: pH 8.2, average shell mass change -0.1 percent; pH 7.8, average shell mass change -2.4 percent; pH 7.4, average shell mass change -6.7 percent. Does the evidence support the claim that lower pH weakens shells? Explain using data.