Practice identifying renewable and non renewable energy sources, comparing their benefits and limitations, and evaluating energy choices using evidence.
Read each problem carefully. Use complete sentences for written responses and show calculations when needed.
Comparing energy sources, impacts, and tradeoffs
Science - Grade 9-12
- 1
Classify each energy source as renewable or non renewable: coal, wind, natural gas, solar, uranium, geothermal, petroleum, and hydropower.
- 2
Explain the main difference between renewable and non renewable energy sources in terms of time scale and supply.
- 3
A town currently gets most of its electricity from coal. Name two environmental problems caused by burning coal for electricity.
- 4
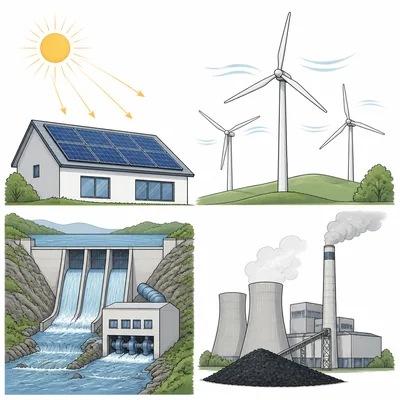
The diagram shows the Sun shining on solar panels, wind turning turbines, water behind a dam, and coal being burned in a power plant. Identify which examples in the diagram are renewable and which are non renewable.
- 5
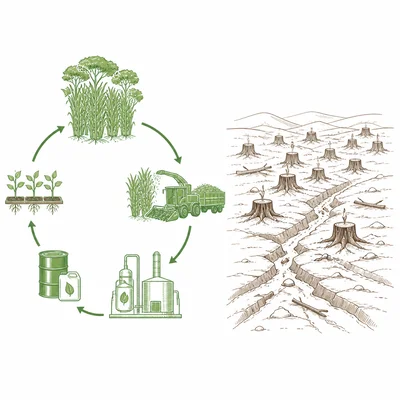
Biomass is often classified as renewable. Explain why biomass can be renewable, and describe one condition under which it may not be sustainable.
- 6
A 500 megawatt coal power plant operates at an average capacity factor of 85 percent for 24 hours. A 500 megawatt wind farm operates at an average capacity factor of 35 percent for the same time. Calculate the energy produced by each in megawatt-hours.
- 7
Why might a wind farm with the same maximum power rating as a coal plant produce less electricity over a week?
- 8
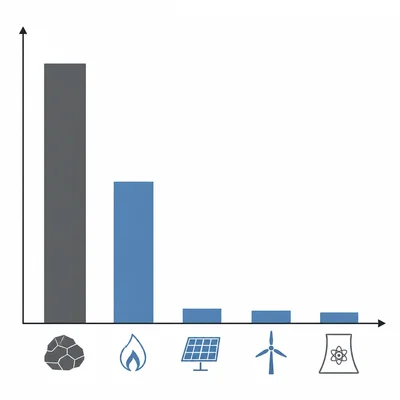
Use the bar graph to compare carbon dioxide emissions per kilowatt-hour from coal, natural gas, solar, wind, and nuclear power. Which two sources are likely to have the highest direct emissions, and why?
- 9
List one advantage and one limitation of solar energy for an electric grid.
- 10
List one advantage and one limitation of nuclear energy. Include whether it is renewable or non renewable.
- 11
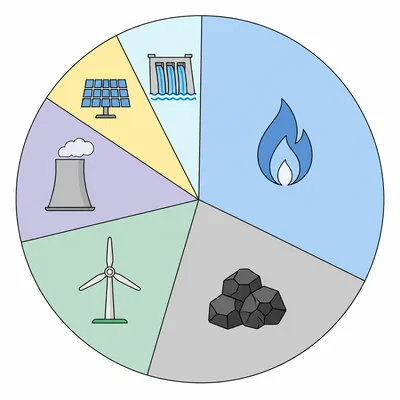
A pie chart shows an energy mix: 40 percent natural gas, 25 percent coal, 15 percent wind, 10 percent nuclear, 5 percent solar, and 5 percent hydropower. What percent of the mix is renewable energy?
- 12
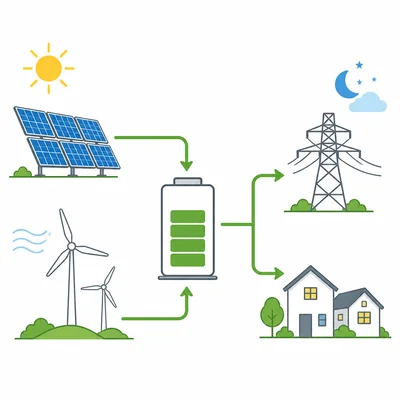
Explain why energy storage can make renewable energy sources such as solar and wind more useful for the electric grid.
- 13
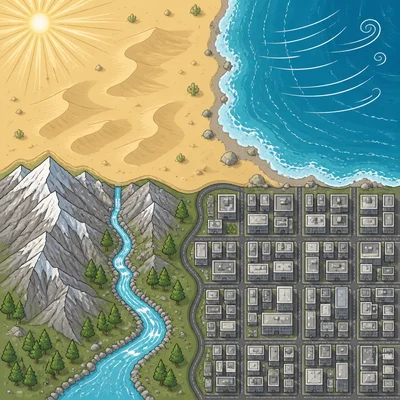
The map shows a sunny desert region, a windy coastline, a mountain river, and a flat urban area with little open land. Match the best renewable energy option to each location and explain one match.
- 14
A community wants to reduce greenhouse gas emissions but is concerned about cost and reliability. Write a short recommendation for an energy plan that uses at least two different energy sources.
- 15
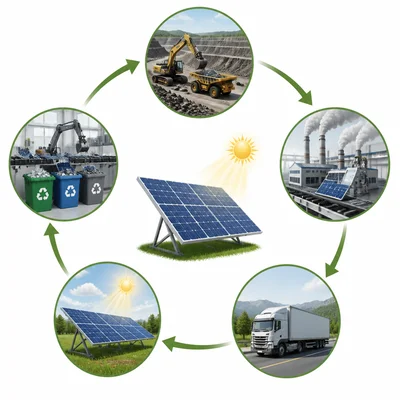
Use the life cycle diagram to explain why a renewable energy source can still have some environmental impact even if it does not burn fuel during operation.