Practice applying the scientific method to high school investigations, including forming hypotheses, identifying variables, designing fair tests, analyzing data, and evaluating conclusions.
Read each problem carefully. Answer in complete sentences and show your reasoning when needed.
Designing, testing, analyzing, and communicating scientific investigations
Science - Grade 9-12
- 1
A student wants to investigate whether the amount of light affects the growth rate of bean plants. Write a testable scientific question for this investigation.
- 2
For the bean plant investigation, write a hypothesis in if-then-because format.
- 3
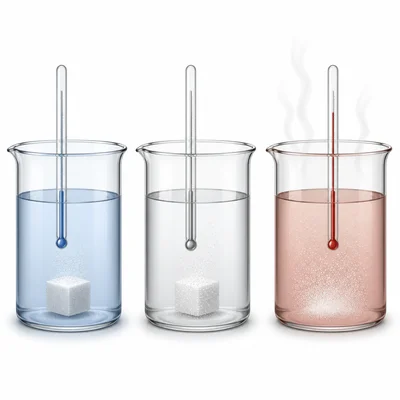
In an experiment testing how water temperature affects the rate at which a sugar cube dissolves, identify the independent variable, dependent variable, and two controlled variables.
- 4
A student tests whether a new fertilizer improves tomato plant growth. One group of plants receives fertilizer, and another group receives no fertilizer. Explain the purpose of the no-fertilizer group.
- 5
A lab group measures reaction time after students drink different amounts of caffeine. List two ways this investigation could be made more reliable.
- 6
A student claims that music improves memory because 8 students remembered more words while listening to music than while sitting in silence. Identify one possible source of bias or error in this conclusion.
- 7
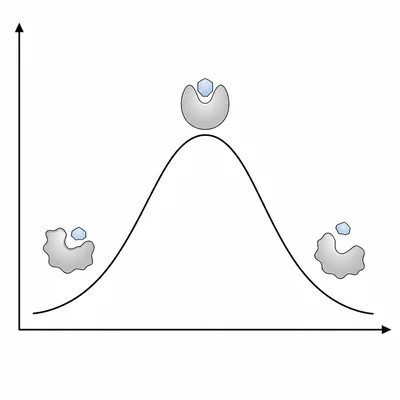
A class measures the effect of pH on enzyme activity. The data show enzyme activity is highest at pH 7 and lower at pH 4 and pH 10. Write a conclusion that is supported by the data.
- 8
A student writes: The chemical reacted faster because it was hotter. Revise this statement into a stronger scientific claim using specific variables.
- 9
A researcher records the following times for a cart to travel 2 meters: 1.25 s, 1.27 s, 1.26 s, and 1.89 s. Which value appears to be an outlier, and what should the researcher do before deciding whether to remove it?
- 10
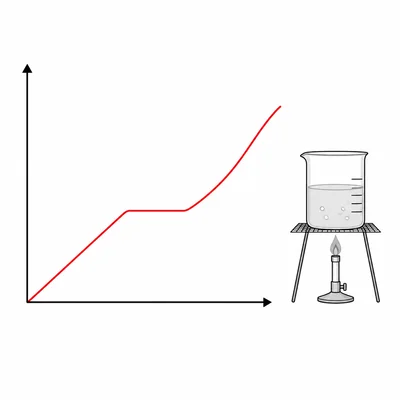
Choose the best type of graph for showing how the temperature of a substance changes over time during heating. Explain your choice.
- 11

A student wants to compare the effectiveness of three disinfectants at reducing bacterial growth on agar plates. Describe a fair experimental design with a control group.
- 12
Explain why scientists repeat trials during an investigation instead of relying on one measurement.
- 13
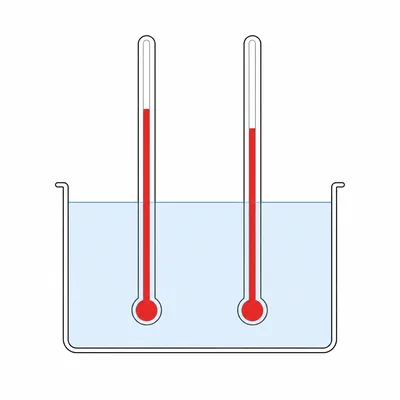
A thermometer consistently reads 2 degrees Celsius too high. Explain how this affects accuracy and precision.
- 14
A group wants to test whether exercise affects heart rate. Identify one ethical or safety concern and explain how the group should address it.
- 15
Read this investigation summary: Students tested whether salt concentration affects the boiling point of water. They heated 100 mL of water with 0 g, 5 g, and 10 g of salt, measured boiling temperature once for each sample, and concluded that salt always raises boiling point. Evaluate the conclusion and suggest one improvement.