Practice finding slope from tables, graphs, points, and real-world situations, and interpret slope as a rate of change.
Read each problem carefully. Show your work in the space provided. Write your answers in complete sentences when you explain your reasoning.
Finding and interpreting how quantities change
Math - Grade 6-8
- 1
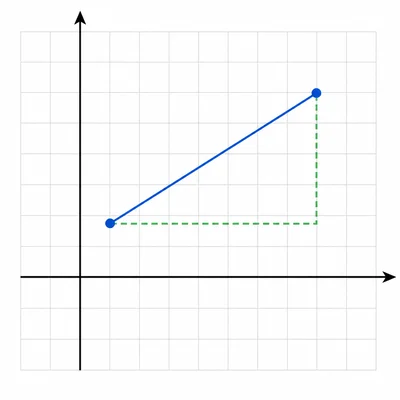
A line passes through the points (2, 3) and (6, 11). Find the slope of the line.
- 2
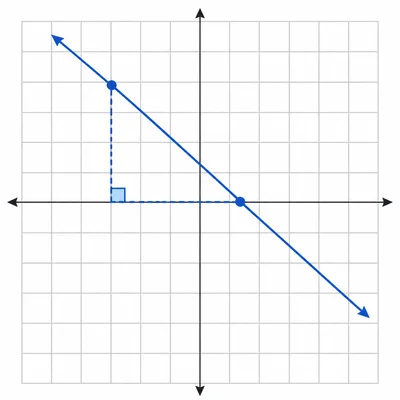
Find the slope of the line that passes through the points (-1, 4) and (3, 0).
- 3
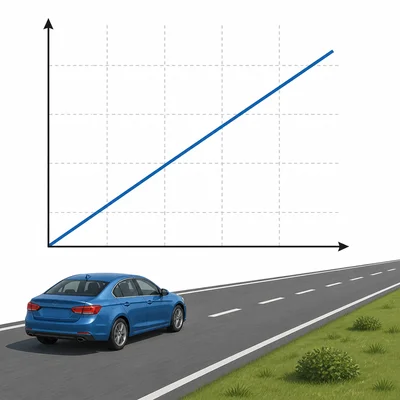
A car travels 120 miles in 3 hours at a constant rate. What is the rate of change in miles per hour?
- 4
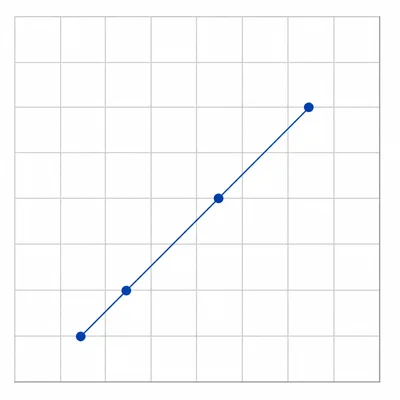
The table shows a relationship between x and y values: x = 1, 2, 3, 4 and y = 5, 8, 11, 14. Find the slope or rate of change.
- 5
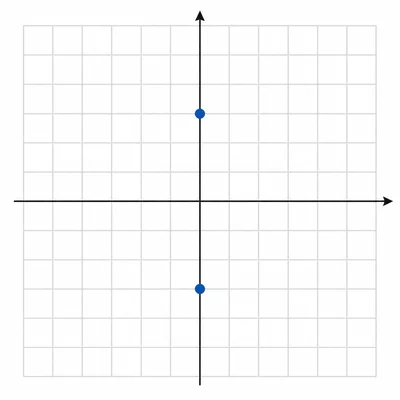
The points (4, 7) and (4, 12) lie on the same line. What can you say about the slope?
- 6
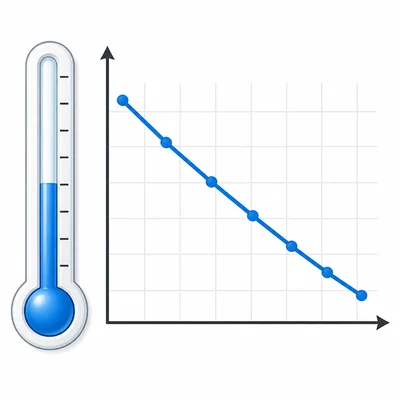
The temperature changes from 18 degrees to 6 degrees over 4 hours. Find the rate of change in degrees per hour.
- 7
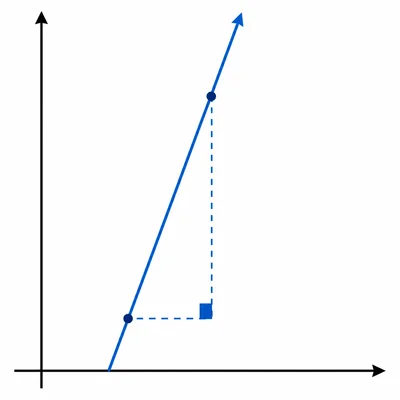
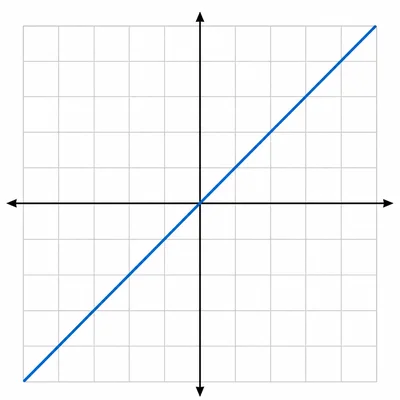
A line has a slope of 5. Explain what this means in terms of rise and run.
- 8
Find the slope of the line through the points (0, -2) and (5, 8).
- 9

A plant grows from 10 centimeters to 22 centimeters in 6 days. What is the rate of change in centimeters per day?
- 10
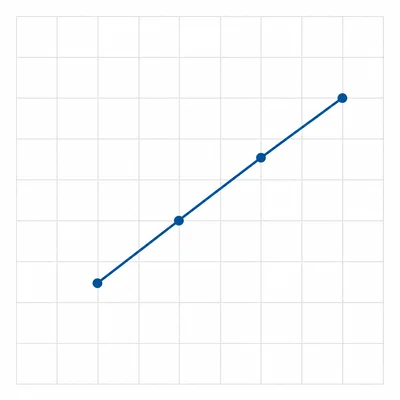
The table shows x = 0, 2, 4, 6 and y = 1, 5, 9, 13. Find the slope.
- 11
Find the slope of the line through the points (-3, -1) and (1, 7).
- 12

A savings account balance goes from 90 dollars to 150 dollars in 5 weeks. What is the rate of change in dollars per week?
- 13
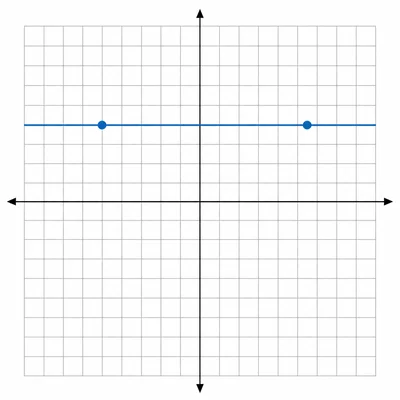
A line has slope 0. Describe what the graph of this line looks like.
- 14
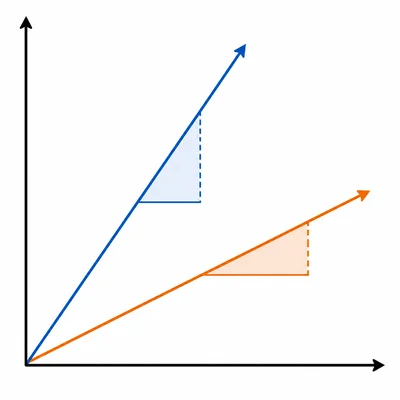
Compare the slopes of these two situations: Line A rises 4 units for every 2 units to the right. Line B rises 3 units for every 1 unit to the right. Which line has the greater slope?
- 15
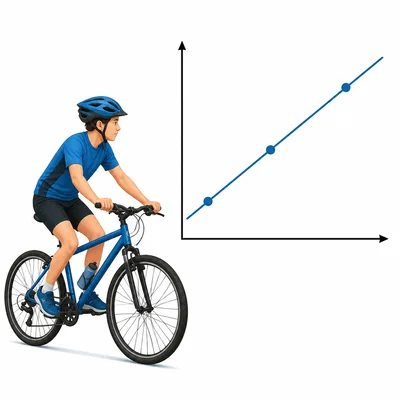
A biker rides 15 miles in 1 hour, then 30 miles in 2 hours, then 45 miles in 3 hours. Is the rate of change constant? If so, what is it?