Partial Derivatives & Gradient Explorer
Pick a function f(x, y), choose a point, and the tool computes the partial derivatives ∂f/∂x and ∂f/∂y, the gradient vector ∇f, its magnitude, and its direction. The gradient is drawn on a contour map so you can see how it points toward steepest ascent.
Contour map and gradient
Click or drag inside the plot to move the point. The teal arrow is ∇f, pointing toward steepest ascent and perpendicular to the contour through the point. Cooler colors are low values, warmer colors are high values.
Controls
Function
Partial derivatives at the point
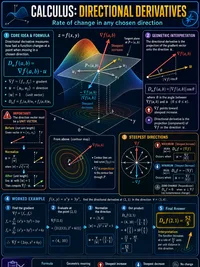
Each partial derivative holds the other variable constant. ∂f/∂x is the slope of f along the x direction, ∂f/∂y is the slope along the y direction.
Gradient vector ∇f
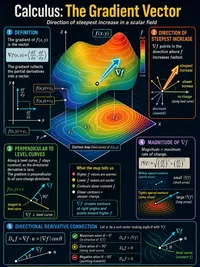
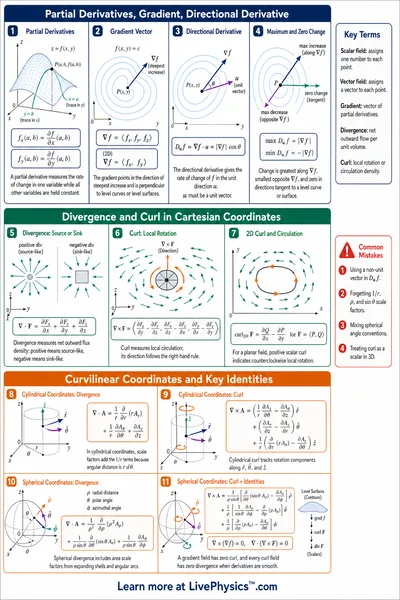
The gradient points in the direction of steepest ascent. Its magnitude is the rate of increase in that direction. It is perpendicular to the contour line through the point.
Understanding Partial Derivatives and the Gradient
What a partial derivative is
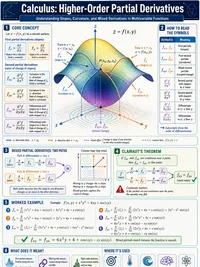
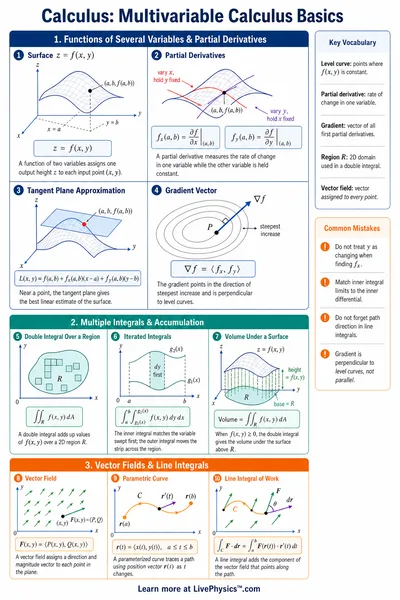
A partial derivative measures how a function changes when you vary one input and hold the others constant. For f(x, y), the partial ∂f/∂x is found by treating y as a fixed number and differentiating with respect to x. The partial ∂f/∂y does the reverse. Each partial is the slope of f along its own axis at the chosen point.
The gradient and steepest ascent
The gradient ∇f = (∂f/∂x, ∂f/∂y) collects both partials into one vector. It points in the direction in which f increases fastest, and its magnitude ‖∇f‖ is that maximum rate of increase. Walking in the opposite direction gives steepest descent, which is the idea behind gradient descent in optimization and machine learning.
Why the gradient is perpendicular to contours
A contour line joins points where f has the same value, so f does not change as you move along it. The gradient measures the direction of greatest change, so it must point straight across the contour, at a right angle to it. On the map the teal arrow always crosses the nearby contour line perpendicularly.
Reading a contour map
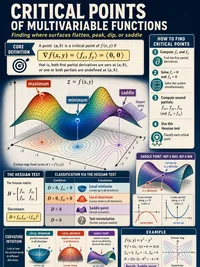
On the plot, cooler colors mark low values and warmer colors mark high values. Closely spaced contours mean f is changing quickly, so the gradient is long there. Widely spaced contours mean a flat region with a short gradient. At a peak, valley, or saddle the gradient shrinks toward zero and the arrow nearly disappears.