Practice applying the laws of thermodynamics to cells, ecosystems, metabolism, and energy transformations in AP Biology.
Read each problem carefully. Use AP Biology vocabulary where appropriate, and show your reasoning in the space provided.
Connecting free energy, entropy, and biological systems
Biology - Grade 9-12
- 1
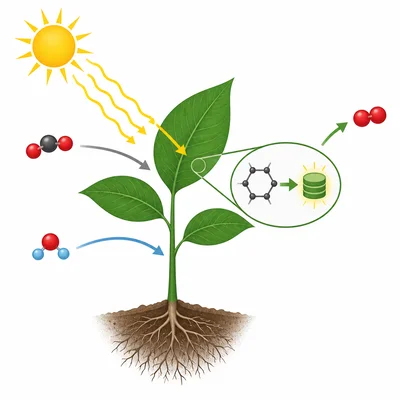
State the first law of thermodynamics and explain how it applies to photosynthesis in plants.
- 2
State the second law of thermodynamics and explain why living organisms do not violate it when they build complex molecules such as proteins and DNA.
- 3
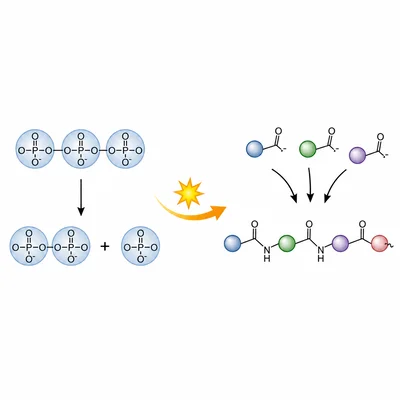
A cell uses ATP hydrolysis to drive the synthesis of a protein. Explain why ATP hydrolysis is often coupled to endergonic reactions.
- 4
The equation for Gibbs free energy is ΔG = ΔH - TΔS. Describe what it means when a biological reaction has a negative ΔG.
- 5
A reaction has ΔH = -40 kJ/mol, T = 300 K, and ΔS = -0.05 kJ/mol·K. Calculate ΔG and determine whether the reaction is spontaneous.
- 6
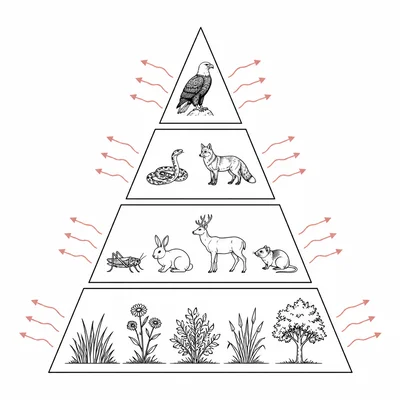
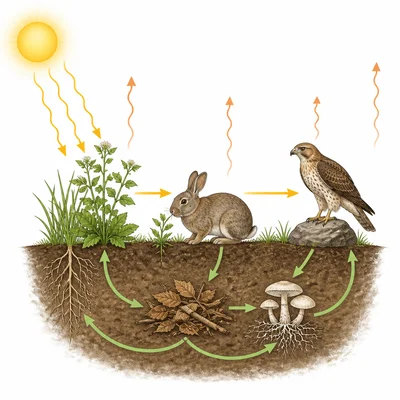
Explain why energy transfer between trophic levels in an ecosystem is inefficient.
- 7
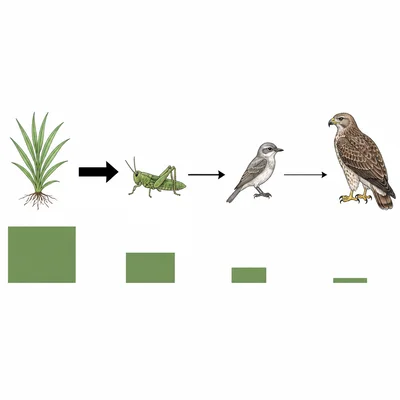
In a simple food chain, producers store 20,000 kJ of energy. If approximately 10 percent of energy is transferred to each next trophic level, how much energy would be available to tertiary consumers after three transfers?
- 8
Compare catabolic and anabolic pathways in terms of energy flow.
- 9
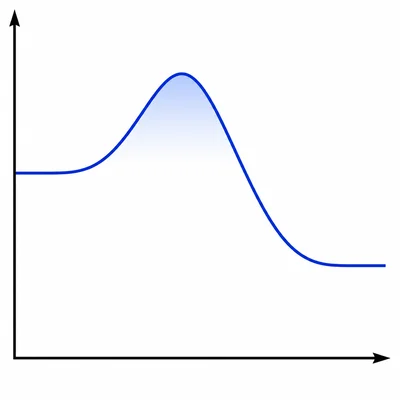
A graph shows free energy on the y-axis and reaction progress on the x-axis. The reactants are higher than the products, and there is a peak between them. Identify whether the reaction is exergonic or endergonic, and explain what the peak represents.
- 10
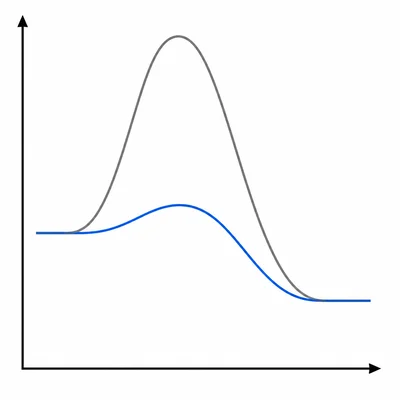
Explain how enzymes affect activation energy and ΔG in a reaction.
- 11
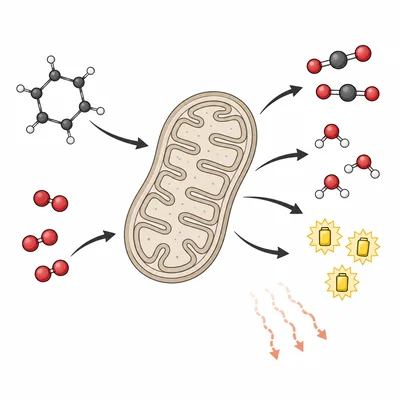
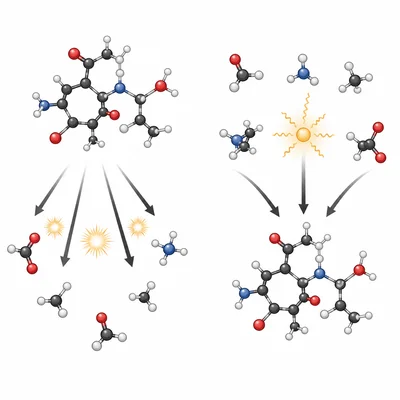
During cellular respiration, glucose is broken down and oxygen is used to produce carbon dioxide, water, and ATP. Explain how this process illustrates energy transformation and entropy increase.
- 12
A student claims that cells recycle energy when they recycle matter such as carbon, nitrogen, and phosphorus. Evaluate this claim using the laws of thermodynamics.