Practice applying the Hardy-Weinberg equations to calculate allele frequencies, genotype frequencies, and evidence for evolution in populations.
Read each problem carefully. Show your work in the space provided. Use p + q = 1 and p^2 + 2pq + q^2 = 1 when appropriate.
Using allele frequencies to model population genetics
Biology - Grade 9-12
- 1
In a population of 1,000 beetles, the recessive phenotype appears in 90 individuals. Assume the population is in Hardy-Weinberg equilibrium. What are q, p, and the expected number of heterozygous beetles?
- 2
A flower color trait has two alleles, R and r. In a population at Hardy-Weinberg equilibrium, the frequency of the r allele is 0.25. What are the expected genotype frequencies for RR, Rr, and rr?
- 3

A diagram shows a gene pool with allele A frequency 0.6 and allele a frequency 0.4. If the population is in Hardy-Weinberg equilibrium, what percentage of the next generation is expected to be heterozygous?
- 4
List the five major conditions that must be met for a population to remain in Hardy-Weinberg equilibrium.
- 5
In a population of moths, 16% have a recessive wing pattern. If the population is in Hardy-Weinberg equilibrium, what percentage of the population is expected to be homozygous dominant?
- 6
A population has 250 AA individuals, 500 Aa individuals, and 250 aa individuals. What are the allele frequencies p and q?
- 7
A population of 400 fish is in Hardy-Weinberg equilibrium. The frequency of the dominant allele B is 0.7. How many fish are expected to have the recessive phenotype?
- 8
In a sample of 200 plants, the observed genotypes are 98 TT, 84 Tt, and 18 tt. Calculate the allele frequencies p and q for the T and t alleles.
- 9
Using the allele frequencies from the plant population in problem 8, calculate the expected numbers of TT, Tt, and tt individuals under Hardy-Weinberg equilibrium for a population of 200 plants.
- 10
A population of birds has genotype counts of 45 BB, 30 Bb, and 25 bb. A student claims the population is definitely in Hardy-Weinberg equilibrium because p + q = 1. Explain why this claim is not enough.
- 11
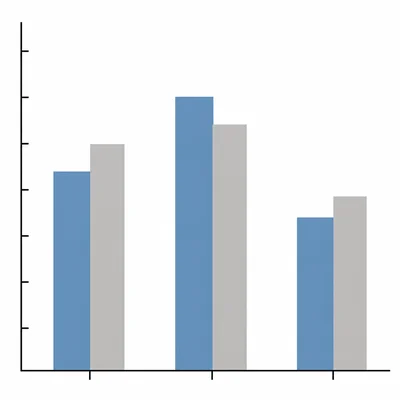
A graph compares observed and expected genotype frequencies in a lizard population. Observed frequencies are AA = 0.30, Aa = 0.60, and aa = 0.10. Expected Hardy-Weinberg frequencies are AA = 0.36, Aa = 0.48, and aa = 0.16. Which genotype shows the largest difference, and what might this suggest?
- 12
Cystic fibrosis is caused by a recessive allele. In a large randomly mating population, 1 in 2,500 newborns has cystic fibrosis. Assuming Hardy-Weinberg equilibrium, estimate the carrier frequency for this allele.