Analyze the causes and effects of urban heat islands and evaluate city planning strategies that can reduce heat risk.
Read each problem carefully. Use evidence, calculations, and clear explanations when needed. Show your work in the space provided.
How city design affects temperature, energy use, and public health
Environmental Science - Grade 9-12
- 1
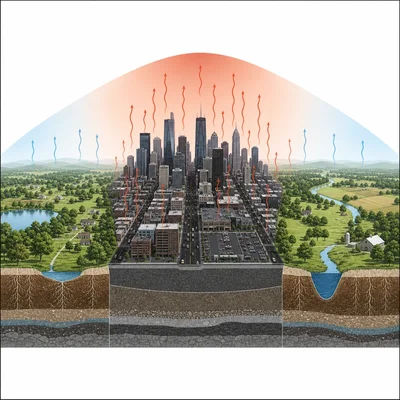
Define the term urban heat island. In your answer, identify two human-made features that often make cities warmer than nearby rural areas.
- 2
A downtown neighborhood has an afternoon air temperature of 36.5°C. A nearby rural area has an afternoon air temperature of 31.8°C. Calculate the urban heat island intensity.
- 3
The table shows surface temperatures measured at 3:00 p.m. on a summer day: black asphalt road, 58°C; concrete sidewalk, 44°C; grass field, 32°C; tree-shaded grass, 28°C. Which surface is likely contributing the most to heat buildup, and why?
- 4
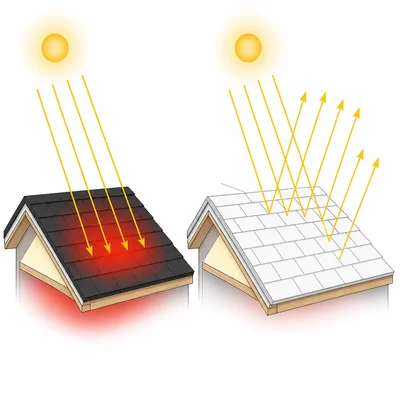
Explain how albedo affects urban temperatures. Include an example of a city planning choice that would increase albedo.
- 5
A city replaces a 10,000 square meter dark roof with a cool roof. The dark roof absorbs 85 percent of incoming sunlight, while the cool roof absorbs 45 percent. If 800 watts per square meter of sunlight reaches the roof, how much less solar power is absorbed after the change?
- 6
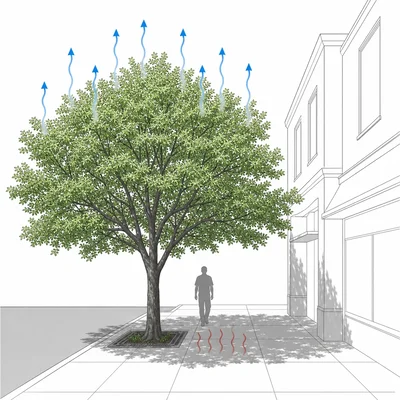
Describe two ways that trees can reduce urban heat. Your answer should include both shade and evapotranspiration.
- 7
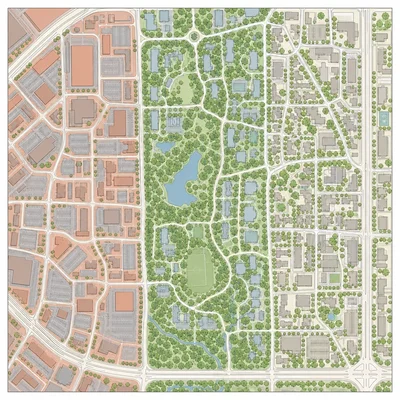
A city map shows three neighborhoods. Neighborhood A has 8 percent tree canopy, many parking lots, and a median income below the city average. Neighborhood B has 35 percent tree canopy, parks, and a median income above the city average. Neighborhood C has 20 percent tree canopy and mixed land use. Which neighborhood should be prioritized first for heat reduction investments, and what environmental justice concern does this example show?
- 8
Explain why urban heat islands can increase electricity demand during summer afternoons. Include one possible feedback effect that can make heat worse.
- 9
A planner proposes adding a large park, planting street trees, using cool roofs, and narrowing some roads to make room for bike lanes and green space. Choose two of these strategies and explain how each could reduce heat or heat exposure.
- 10
A city has a heat emergency plan that opens cooling centers from 12:00 p.m. to 6:00 p.m. only. Explain one strength of this plan and one limitation that city leaders should address.
- 11
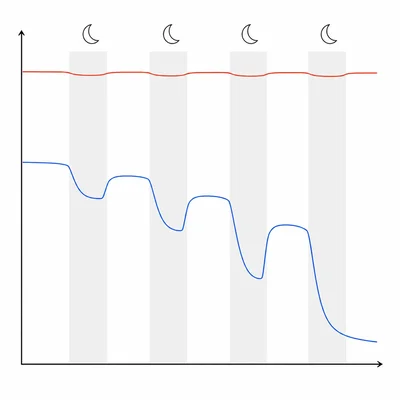
The graph shows that nighttime temperatures in a dense urban neighborhood stay above 29°C for five nights in a row, while a nearby rural area drops to 22°C each night. Explain why nighttime heat is especially dangerous for human health.
- 12
Design a short urban heat island study for your school or neighborhood. Identify the question you would investigate, the data you would collect, when and where you would collect it, and how the results could guide city planning.