Practice solving, graphing, and interpreting systems of linear inequalities in two variables.
Read each problem carefully. Solve each system or describe its solution set. Show your work and use graph paper if needed.
Solving and graphing systems of linear inequalities
Math - Grade 9-12
- 1
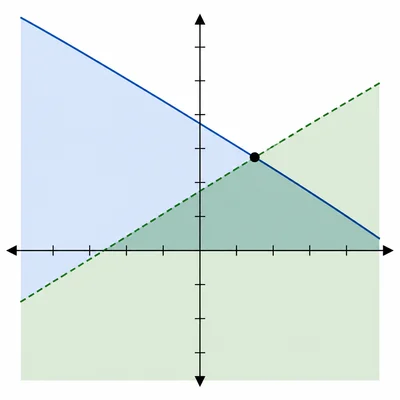
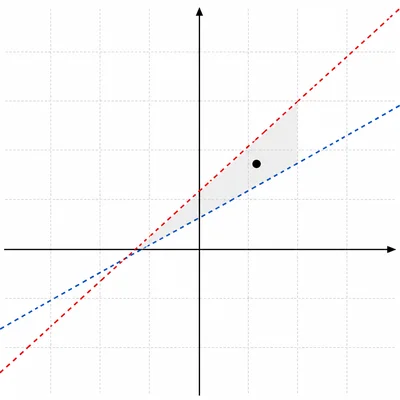
Solve the system and describe the solution set: y > 2x - 1 and y <= x + 3.
- 2
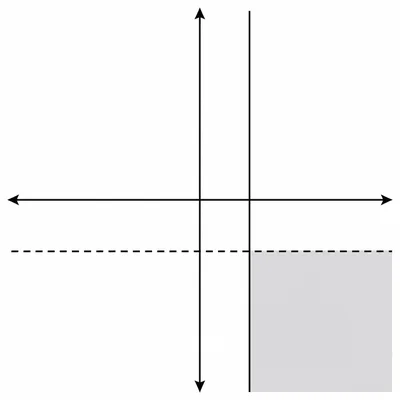
Graph the system: x >= -2 and y < 4. Describe the region that is shaded.
- 3
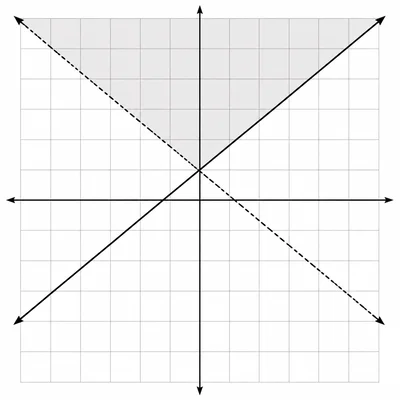
Determine whether the point (2, 1) is a solution to the system: y < x and y >= -x + 2.
- 4
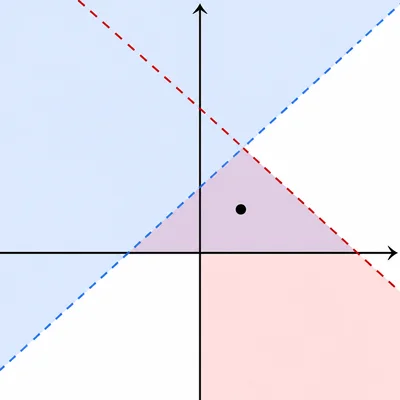
Determine whether the point (-1, 3) is a solution to the system: y <= 2x + 5 and y > -x + 1.
- 5
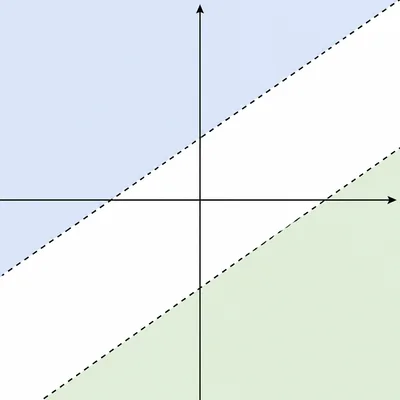
Write the system of inequalities represented by this description: the region above the line y = -3x + 2 and on or below the line y = x - 1.
- 6
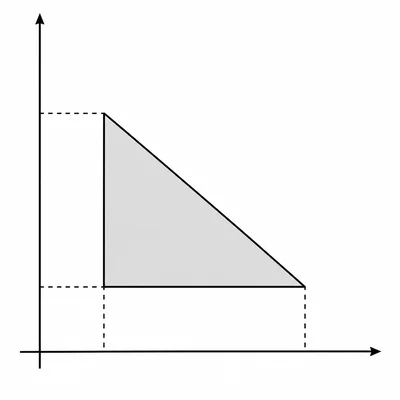
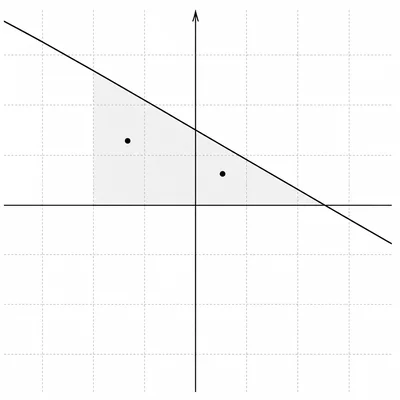
A school club sells notebooks for x dollars and pens for y dollars. The prices must satisfy x >= 1, y >= 0.5, and x + y <= 5. Describe what the solution set represents.
- 7
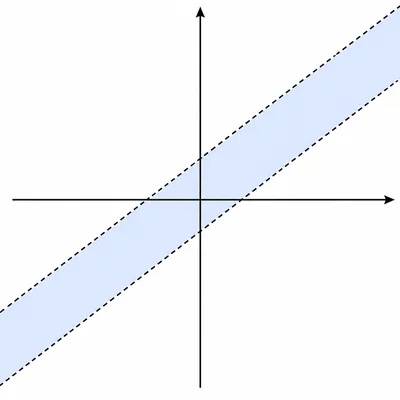
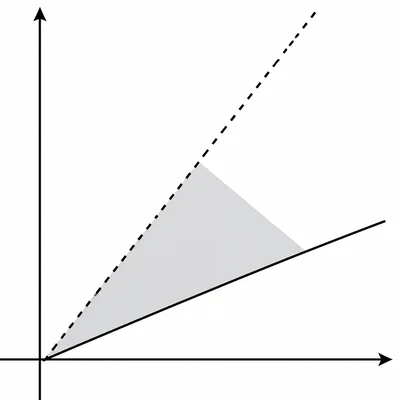
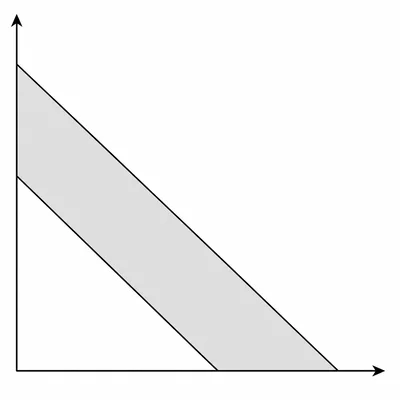
Solve the system: y < -2x + 6 and y > -2x + 1. Describe the region between the lines.
- 8
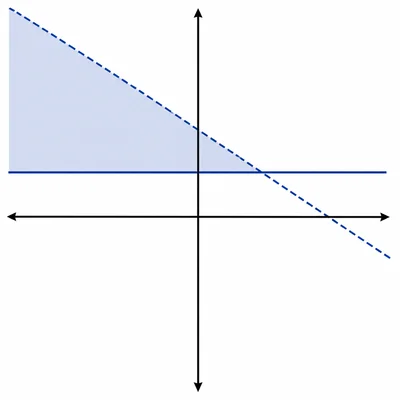
Graph and describe the solution set for the system: y >= 3 and y < -x + 7.
- 9
Find one point that satisfies the system y > x - 4 and y < 2x + 1. Explain why it works.
- 10
Is there a solution to the system y > x + 2 and y < x - 1. Explain your reasoning.
- 11
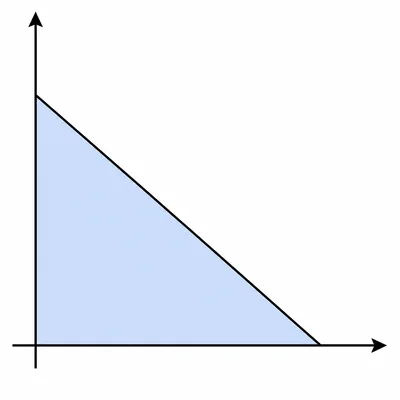
Write a system of two inequalities whose solution is the region in the first quadrant below the line y = -x + 6.
- 12
A student must spend at least 4 hours on math, x, and science, y, combined, so x + y >= 4. The student also wants to spend no more than 6 hours total, so x + y <= 6, with x >= 0 and y >= 0. Describe the feasible region.
- 13
For the system y <= -x + 5 and y >= 2, find two ordered pairs that are solutions.
- 14
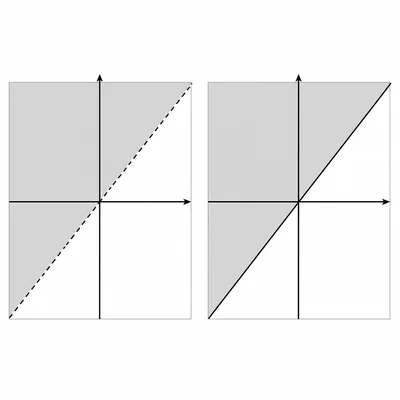
Explain the difference between graphing y < 2x + 1 and y <= 2x + 1 in a system of inequalities.
- 15
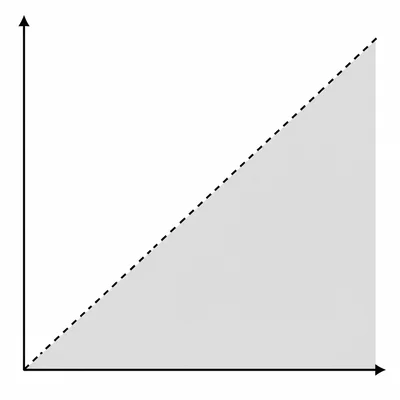
A graph shows the overlap of these inequalities: x > 0, y > 0, and y < x + 2. Describe the solution set in words.