Practice using tables, coordinate graphs, equations, and patterns to understand relationships between two variables.
Read each problem carefully. Show your work in the space provided and explain your reasoning when asked.
Represent and interpret relationships between two quantities
Math - Grade 6-8
- 1
The table shows the cost of notebooks at a school store. 1 notebook costs $2, 2 notebooks cost $4, 3 notebooks cost $6, and 4 notebooks cost $8. What is the rule relating the number of notebooks, n, to the cost, c?
- 2
A taxi charges a starting fee of $5 plus $3 for each mile. Complete the table for 0, 1, 2, 3, and 4 miles, then write an equation for the total cost, c, in dollars after m miles.
- 3
The points (1, 4), (2, 7), (3, 10), and (4, 13) follow a pattern. What is the change in y for each increase of 1 in x? Write an equation for the relationship.
- 4
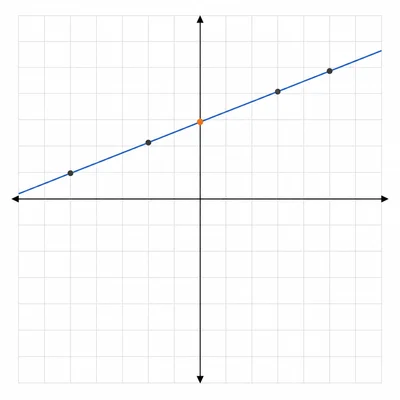
A graph of a relationship contains the points (0, 2), (1, 5), (2, 8), and (3, 11). What is the y-intercept, and what does it mean in this relationship?
- 5
The table shows the number of cups of flour needed for batches of muffins: 1 batch needs 2 cups, 2 batches need 4 cups, 3 batches need 6 cups, and 4 batches need 8 cups. Is this a proportional relationship? Explain.
- 6
A gym charges a one-time sign-up fee of $20 plus $10 per month. Is the relationship between months and total cost proportional? Explain.
- 7
The ordered pairs (2, 6), (4, 12), (6, 18), and (8, 24) are graphed. Describe the pattern and write the equation.
- 8

A plant is 6 centimeters tall when it is measured on day 0. It grows 2 centimeters each day. Make a table for days 0 through 5 and write an equation for the height, h, after d days.
- 9
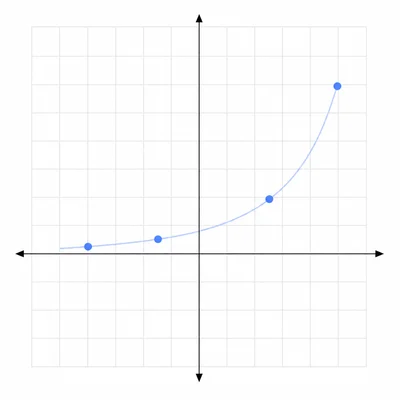
A student says the relationship in the table x: 1, 2, 3, 4 and y: 2, 4, 8, 16 is linear because y increases each time. Is the student correct? Explain.
- 10
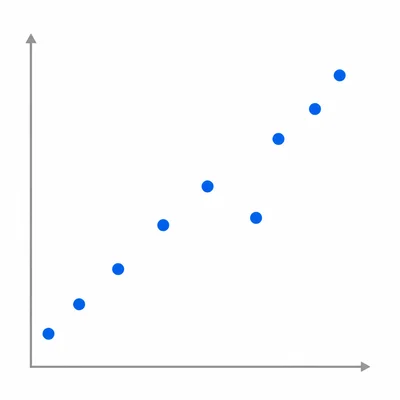
The scatter plot shows hours studied and quiz scores for 10 students. The points generally rise from left to right. What type of association does the scatter plot show, and what does it mean?
- 11
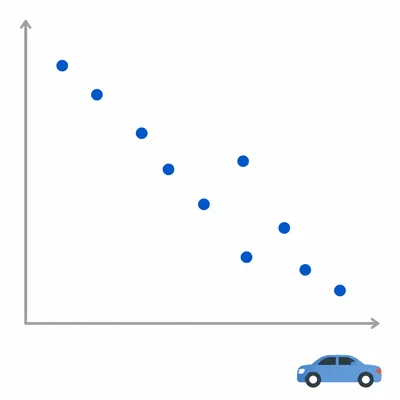
The scatter plot shows the age of a used car and its selling price. The points generally fall from left to right. What type of association does the scatter plot show, and what does it mean?
- 12
For the equation y = 4x - 3, find the y-values when x = 0, 1, 2, and 3. Then describe the pattern.
- 13
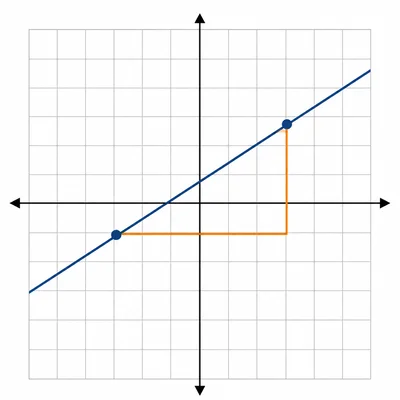
A line goes through the points (3, 9) and (7, 17). What is the rate of change of y with respect to x?
- 14
A movie rental service charges $4 per movie plus a monthly membership fee. The table shows that 2 movies cost $14 and 5 movies cost $26. What is the monthly membership fee?
- 15
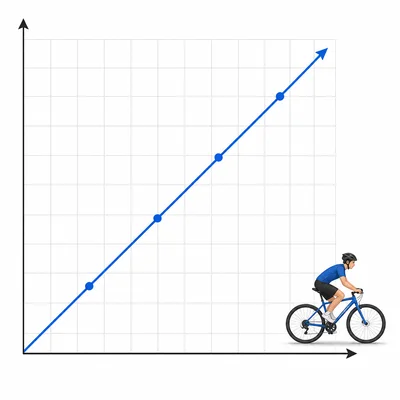
A graph shows the relationship between time and distance for a bicyclist. The line starts at (0, 0) and passes through (2, 18) and (4, 36). What is the bicyclist's speed in miles per hour?