Practice interpreting logistic regression models, odds, odds ratios, predicted probabilities, and categorical outcomes.
Read each problem carefully. Show your work in the space provided. Round probabilities to three decimal places unless another rounding rule is given.
Modeling probabilities for yes-or-no outcomes
Statistics - Grade 9-12
- 1
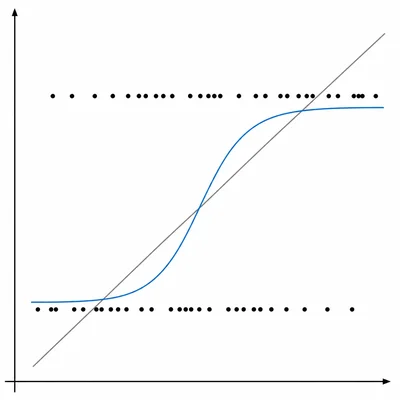
A school wants to predict whether a student passes a certification exam. The outcome is pass or not pass. Explain why logistic regression is more appropriate than linear regression for this situation.
- 2
A logistic regression model predicts the probability that a customer buys a product using the equation log(p/(1 - p)) = -2.0 + 0.5x, where x is the number of website visits. What is the log-odds when x = 4?
- 3
Using the model log(p/(1 - p)) = -2.0 + 0.5x, find the predicted probability that a customer buys a product when x = 4 website visits.
- 4
A logistic regression model is log(p/(1 - p)) = -1.2 + 0.8x, where x = 1 if a person saw an ad and x = 0 if the person did not see the ad. What is the log-odds for a person who did not see the ad?
- 5
For the model log(p/(1 - p)) = -1.2 + 0.8x, where x = 1 if a person saw an ad and x = 0 if the person did not see the ad, what is the odds ratio for seeing the ad compared with not seeing the ad? Round to two decimal places.
- 6
A model predicts whether a student joins an after-school club. The coefficient for hours spent at school events is 0.4. Interpret this coefficient in terms of odds.
- 7
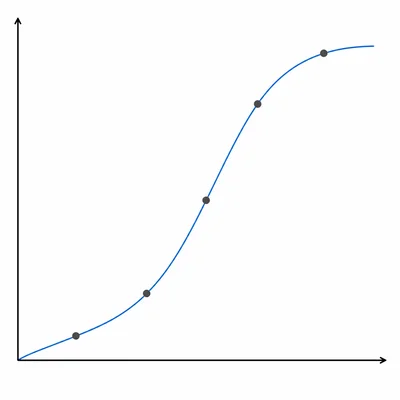
The table shows predicted probabilities from a logistic regression model for passing a driving test based on practice hours. Describe the overall pattern shown by the predictions: 0 hours: 0.18, 2 hours: 0.31, 4 hours: 0.50, 6 hours: 0.69, 8 hours: 0.82.
- 8
A logistic regression model gives a predicted probability of 0.75 that a student will submit homework on time. What are the predicted odds of submitting homework on time?
- 9
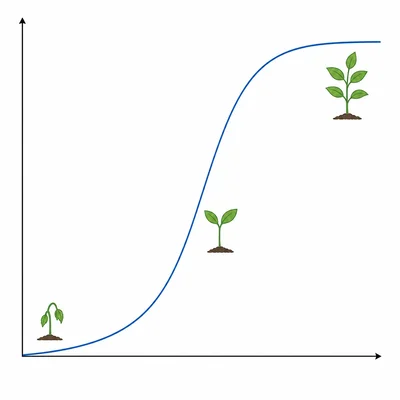
A logistic curve is shown for the probability that a plant survives based on days of watering. The curve starts near 0 for very few watering days, rises quickly in the middle, and levels off near 1 after many watering days. Explain why this shape makes sense for a probability model.
- 10
A researcher codes the outcome as 1 for owns a bicycle and 0 for does not own a bicycle. The model includes distance from school as a predictor, and the coefficient is -0.3. What does the negative coefficient suggest?
- 11

A confusion matrix for a model predicting whether emails are spam is shown: actual spam predicted spam = 42, actual spam predicted not spam = 8, actual not spam predicted spam = 10, actual not spam predicted not spam = 40. How many emails were classified correctly, and what was the accuracy?
- 12

A model predicts whether a patient has a condition. Using a cutoff of 0.50, predicted probabilities of 0.50 or higher are classified as yes. Classify these four patients: Patient A = 0.82, Patient B = 0.47, Patient C = 0.50, Patient D = 0.12.