Practice building and interpreting confidence intervals, margins of error, and the meaning of confidence levels in real-world settings.
Read each problem carefully. Show your work when calculations are needed, and write interpretations in complete sentences.
Estimating population values with samples
Statistics - Grade 9-12
- 1
A survey of 200 students found that 124 prefer online homework. Find the sample proportion of students who prefer online homework.
- 2
A poll reports that 48% of voters support a proposal, with a margin of error of 3 percentage points. Write the confidence interval for the true percent of voters who support the proposal.
- 3
A confidence interval for the average number of minutes students spend reading each night is 22 minutes to 34 minutes. Find the margin of error.
- 4
A 95% confidence interval for the mean height of a certain plant species is 18.4 cm to 21.6 cm. Write a correct interpretation of this interval.
- 5
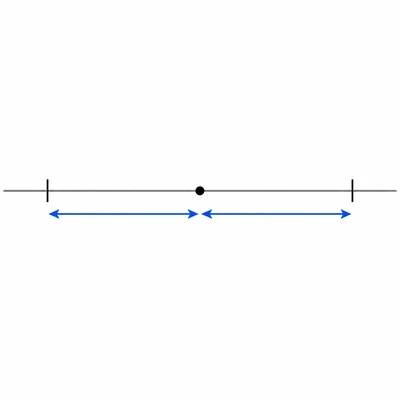
A sample mean is 72 and the margin of error is 5. Write the confidence interval.
- 6
A news report says, "The survey has a margin of error of plus or minus 4%." Explain what this means in plain language.
- 7
A researcher wants a smaller margin of error when estimating a population proportion. Should the researcher use a larger sample size or a smaller sample size? Explain.
- 8

A 90% confidence interval for the proportion of teens who have a part-time job is 0.28 to 0.36. Find the point estimate.
- 9
A sample of 64 batteries has a mean life of 40 hours. The standard deviation is known to be 8 hours. Using a 95% confidence level with z = 1.96, find the margin of error. Use the formula margin of error = z times standard deviation divided by square root of n.
- 10
Using the information from the battery problem, write the 95% confidence interval for the true mean battery life.
- 11
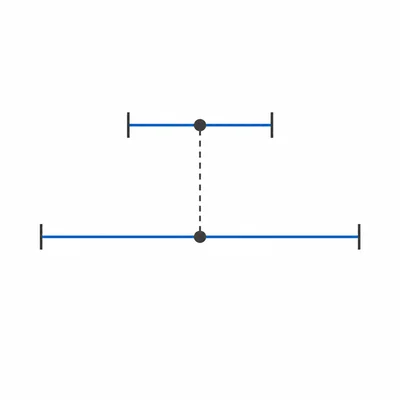
Two surveys estimate the same population proportion. Survey A has a confidence interval of 52% to 58%. Survey B has a confidence interval of 49% to 61%. Which survey has the smaller margin of error? Explain.
- 12
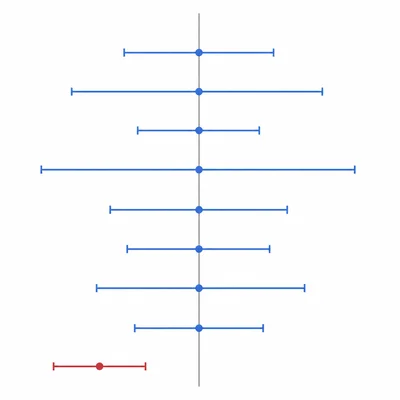
A student says, "A 95% confidence interval means there is a 95% chance that the sample mean is in the interval." Explain why this statement is not correct.