Practice interpreting multiple regression equations, coefficients, predictions, and interaction terms in real-world contexts.
Read each problem carefully. Show your work and explain your reasoning in the space provided.
Interpreting models with more than one predictor
Statistics - Grade 9-12
- 1
A regression model predicts a student's exam score from hours studied and hours slept: predicted score = 48 + 6.2(hours studied) + 3.5(hours slept). What is the predicted score for a student who studied 5 hours and slept 7 hours?
- 2
In the model predicted house price in thousands of dollars = 120 + 35(bedrooms) + 0.8(square feet in hundreds), interpret the coefficient 35 for bedrooms.
- 3
A model predicts monthly sales using advertising spending and store size: predicted sales = 20 + 4(ad spending in thousands) + 1.5(store size in hundreds of square feet). Compare two stores that are the same size. If Store A spends $3,000 more on advertising than Store B, how much higher are Store A's predicted monthly sales?
- 4
A regression equation is predicted final grade = 50 + 4(homework hours) + 2(class participation score). A student has 6 homework hours and a class participation score of 8. Another student has 4 homework hours and a class participation score of 10. Which student has the higher predicted final grade, and by how much?
- 5
A multiple regression model uses temperature and number of customers to predict daily ice cream sales. The coefficient for temperature is 18 when number of customers is also in the model. What does it mean to say the coefficient for temperature is interpreted while holding number of customers constant?
- 6
A model for predicted test score includes an interaction term: predicted score = 40 + 5(study hours) + 3(tutor) + 2(study hours × tutor), where tutor = 1 if the student had a tutor and 0 if not. What is the predicted score for a student who studied 4 hours and had a tutor?
- 7
Using the same model, predicted score = 40 + 5(study hours) + 3(tutor) + 2(study hours × tutor), what is the predicted score for a student who studied 4 hours and did not have a tutor?
- 8
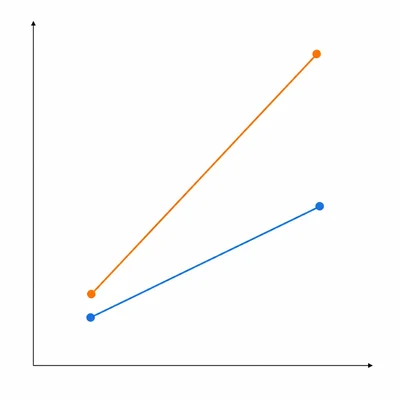
Compare the two students from Problems 6 and 7. According to the model, how much higher is the predicted score for the student with a tutor after 4 hours of studying?
- 9
A model predicts plant height in centimeters: predicted height = 10 + 4(water) + 6(fertilizer) + 3(water × fertilizer), where water is measured in liters and fertilizer = 1 if fertilizer was used and 0 if not. What is the effect of one additional liter of water when fertilizer is not used?
- 10
Using the model predicted height = 10 + 4(water) + 6(fertilizer) + 3(water × fertilizer), what is the effect of one additional liter of water when fertilizer is used?
- 11
A table shows predictions from a regression model with an interaction between exercise hours and diet plan. The predicted weight loss is 2 pounds for 0 exercise hours with no diet plan, 5 pounds for 1 exercise hour with no diet plan, 4 pounds for 0 exercise hours with the diet plan, and 9 pounds for 1 exercise hour with the diet plan. Does the effect of exercise appear to be the same for both diet groups? Explain.
- 12
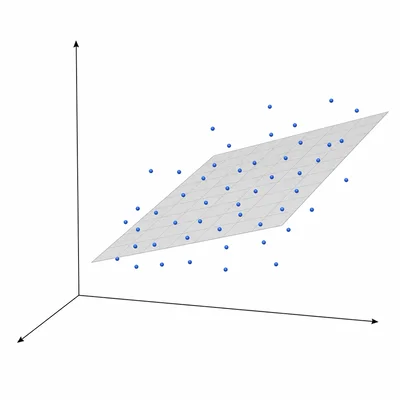
A scatterplot shows that income and years of education are both positively related to spending on books. A multiple regression model includes both predictors. Why might the coefficient for education be different in the multiple regression model than in a simple regression model using education alone?