Sign in to save

Bookmark this page so you can find it later.

Sign in to save

Bookmark this page so you can find it later.

Math high-school May 24, 2026

Why Do Insurance Companies Always Win in the Long Run?

How averages make risk predictable
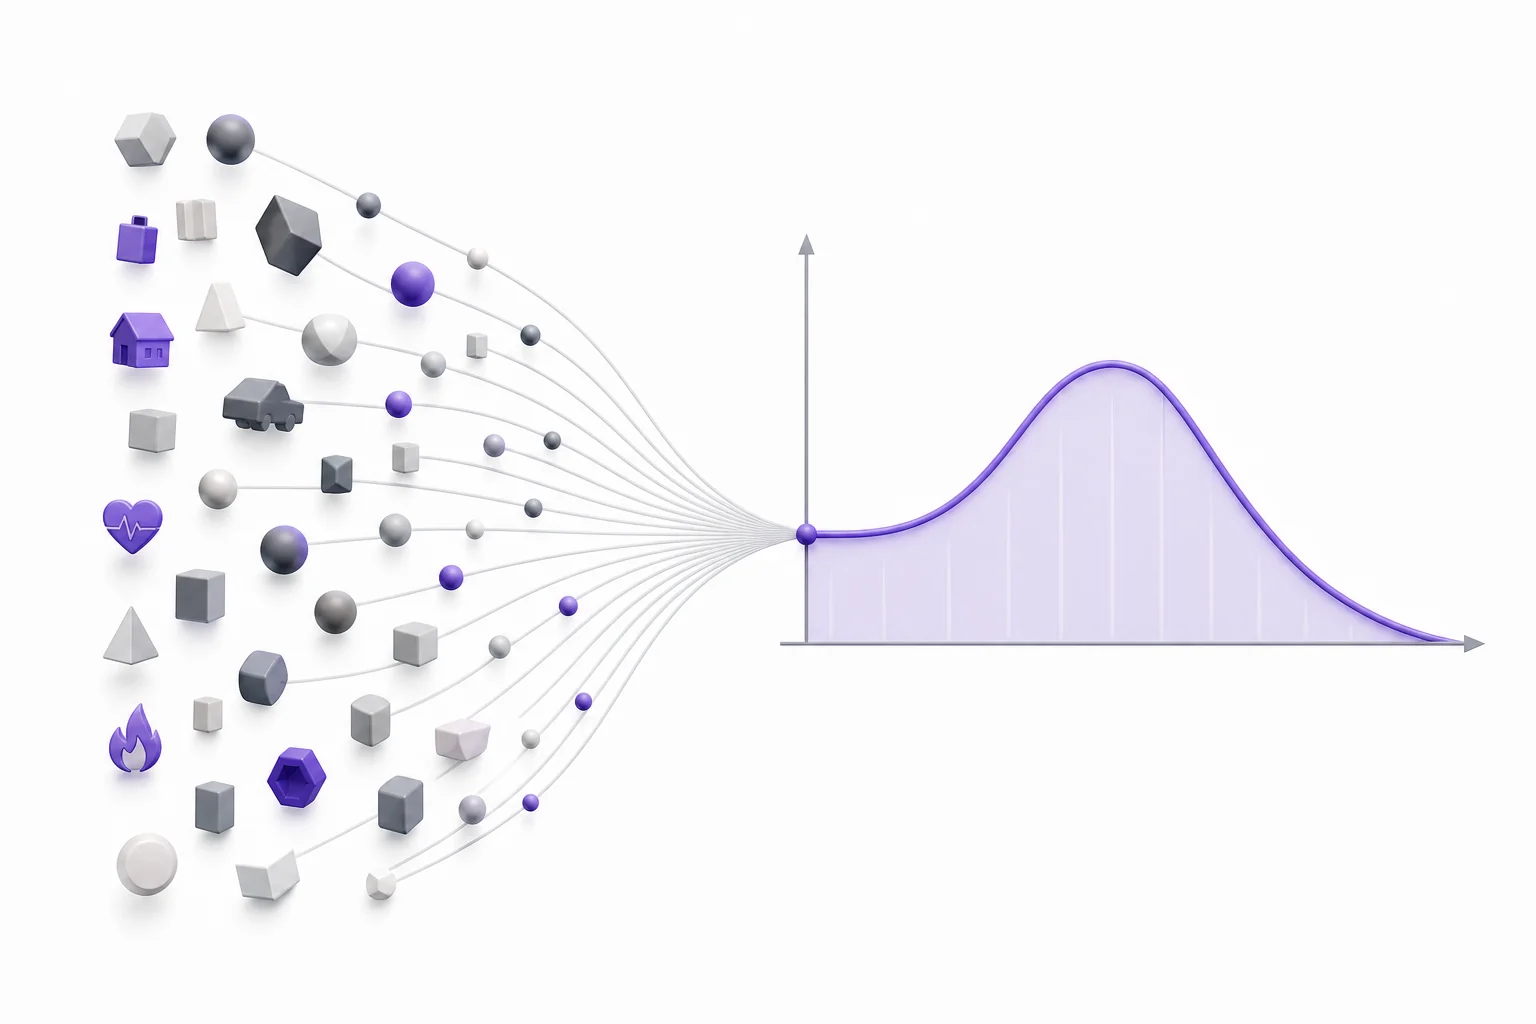
A math illustration showing many policyholders paying small premiums into a shared pool while a few large claims are paid out

Insurance companies charge many people a little more than they expect to pay back in claims. One customer may have a huge loss, but thousands of customers spread out the surprises. Over many policies, the company’s average result gets close to its plan.

Big Idea. Common Core HSS-MD.B.5 uses expected value to compare decisions and explain fair games, insurance, and risk.

Insurance looks strange from one person’s view. You may pay for years and never file a claim. Another person may pay one premium and then receive a huge payout after a crash, fire, or medical emergency. That does not mean the company is guessing. It is using probability. For each type of policy, the company estimates how often losses happen and how large those losses tend to be. Then it sets a premium that is higher than the average payout it expects. That extra amount pays for employees, reserves, taxes, and profit. The key math idea is expected value, which is a weighted average of possible outcomes. If a loss of $\$10{,}000$ happens with probability $\frac{1}{100}$, the expected claim cost is $\$100$. A single customer can be unpredictable. A large group is much more stable.

The bet is not even
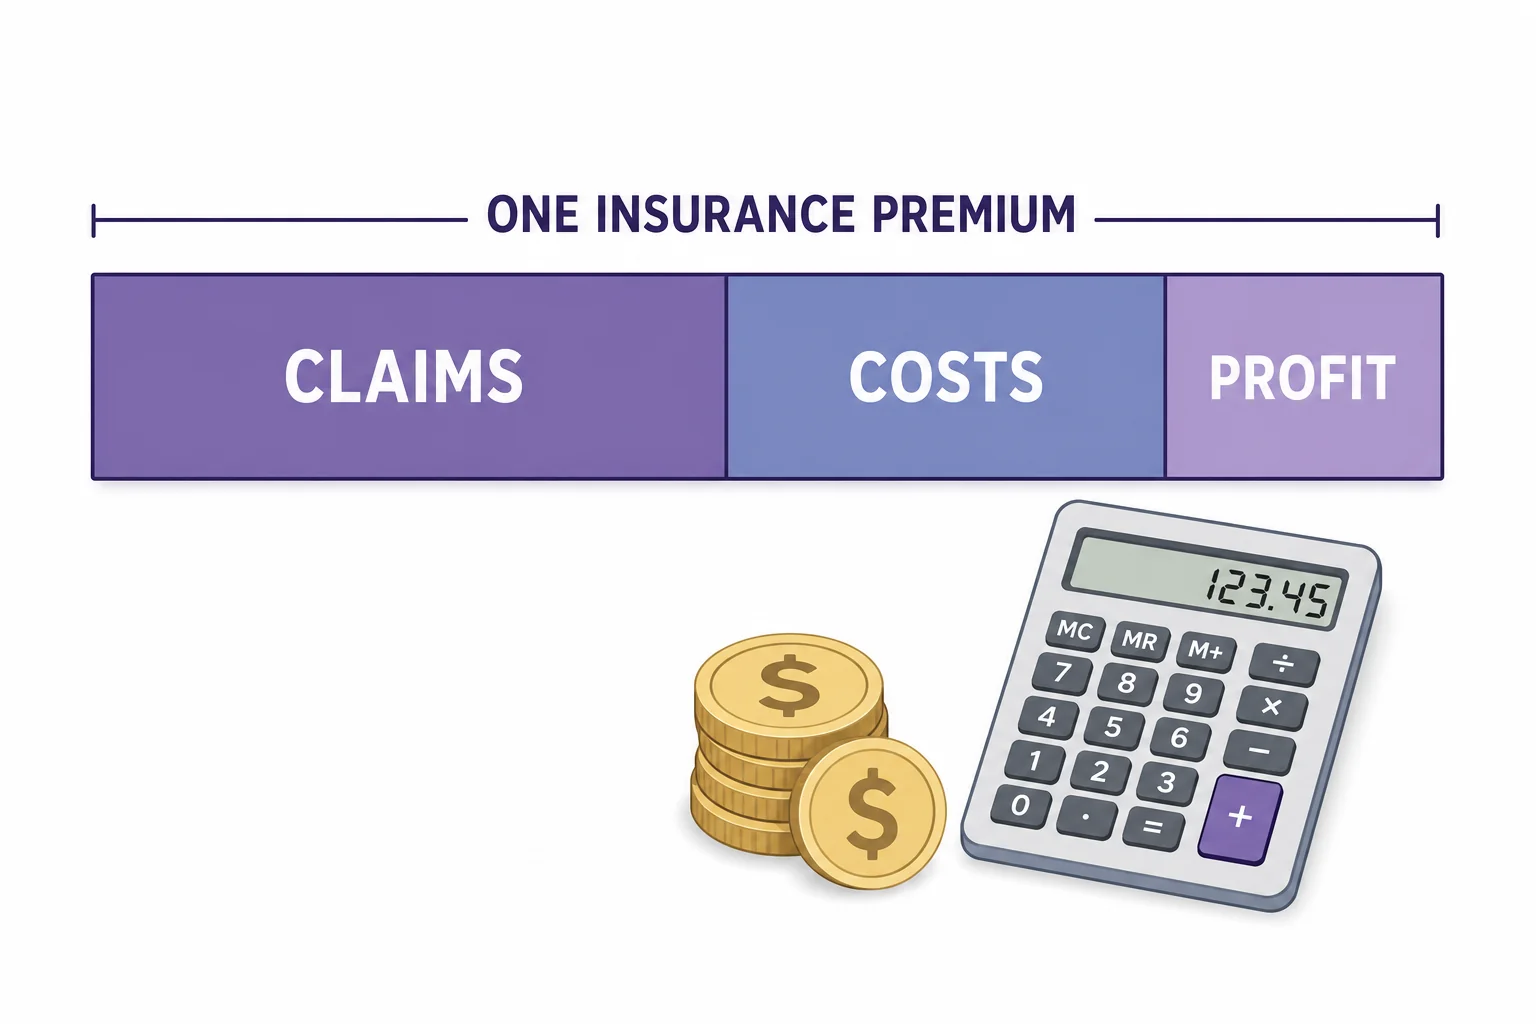
A bar model showing a premium split into expected claims, expenses, and profit
Premiums are priced above expected claims.
A simple insurance model starts with expected value. Suppose 1 out of 100 similar drivers is expected to have a $\$10{,}000$ claim this year. The average claim cost per driver is $\$100$. If the company charged exactly $\$100$, it would break even only before paying workers, offices, software, taxes, and emergency reserves. So the premium might be $\$140$ instead. That price has two parts. The first part covers the expected claim. The second part is the loading, which covers costs and profit. From the customer’s view, the policy may still be worth buying because it trades a small known payment for protection from a large unknown loss. From the company’s view, the policy is priced so the average outcome is positive.

The company does not need every policy to be profitable.

One loss is noisy
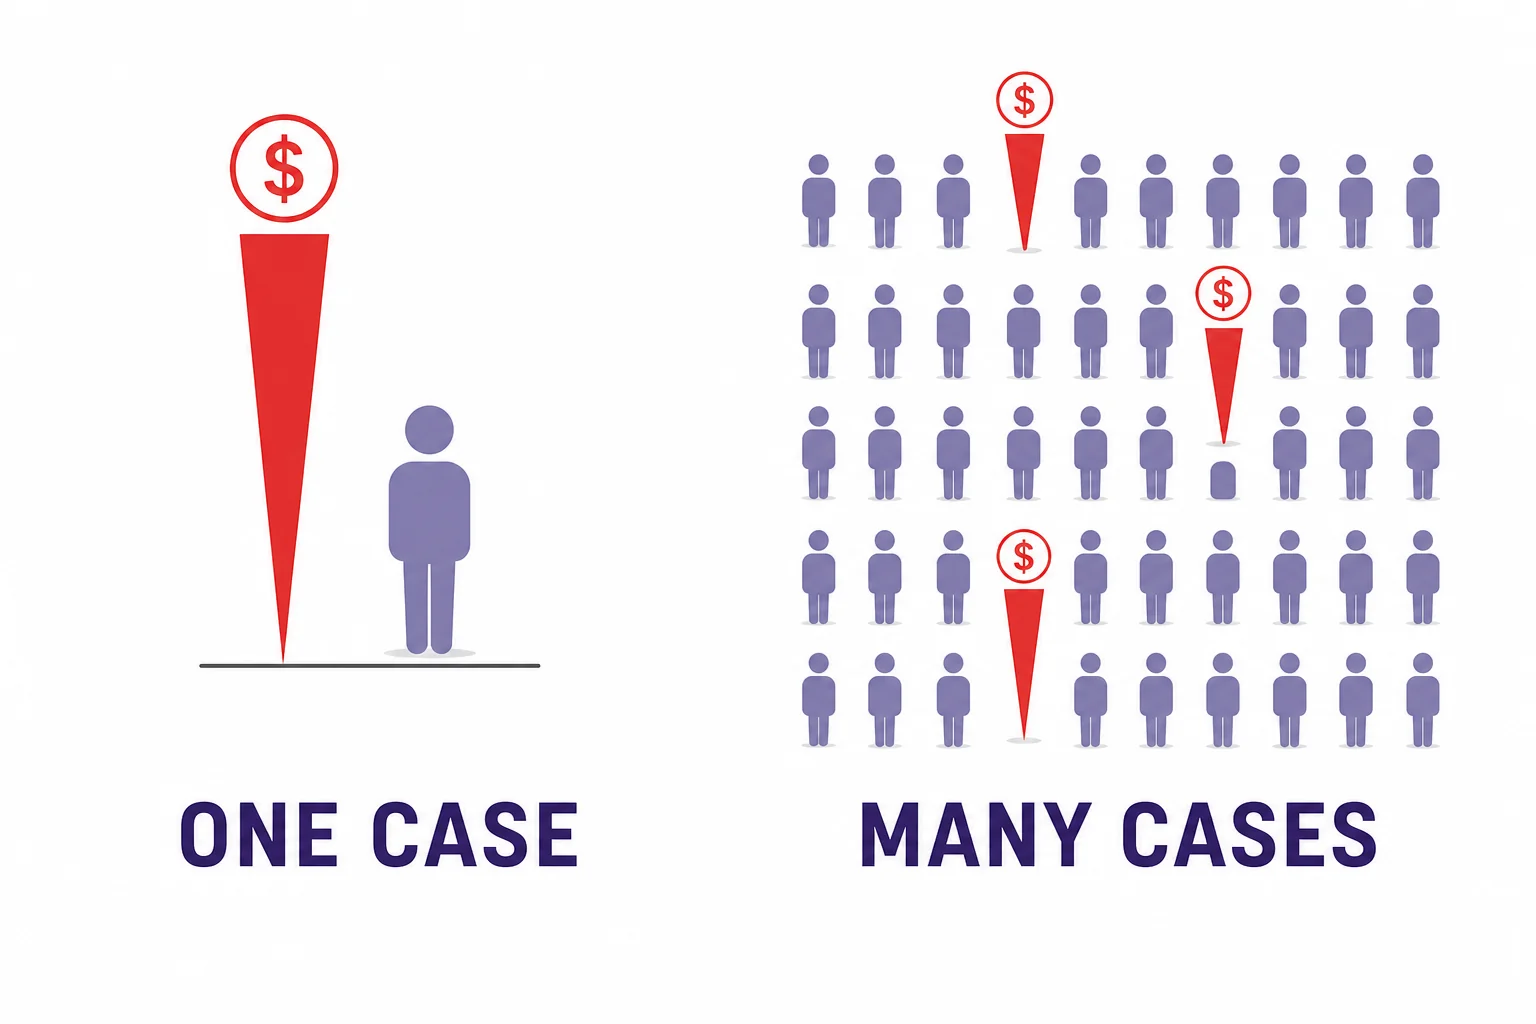
A diagram comparing one customer with a large claim to many customers with mostly no claims
One person is unpredictable. A pool is steadier.
An individual claim is a random event. One family may pay home insurance for decades without a fire. Another may have a large fire after one month. These stories feel very different, but neither one changes the basic pricing model by itself. The company planned for some customers to file large claims and many customers to file no claims. This is why one big payout does not mean the company lost overall. It matters how that payout fits into the whole pool. Insurance works best when losses are not all happening at the same time. If claims are spread across many people and places, the total is easier to predict. If one event causes many claims at once, such as a major hurricane, the risk becomes harder and more expensive to cover.

Insurance math is about the group, not the single story.

Large numbers smooth the average
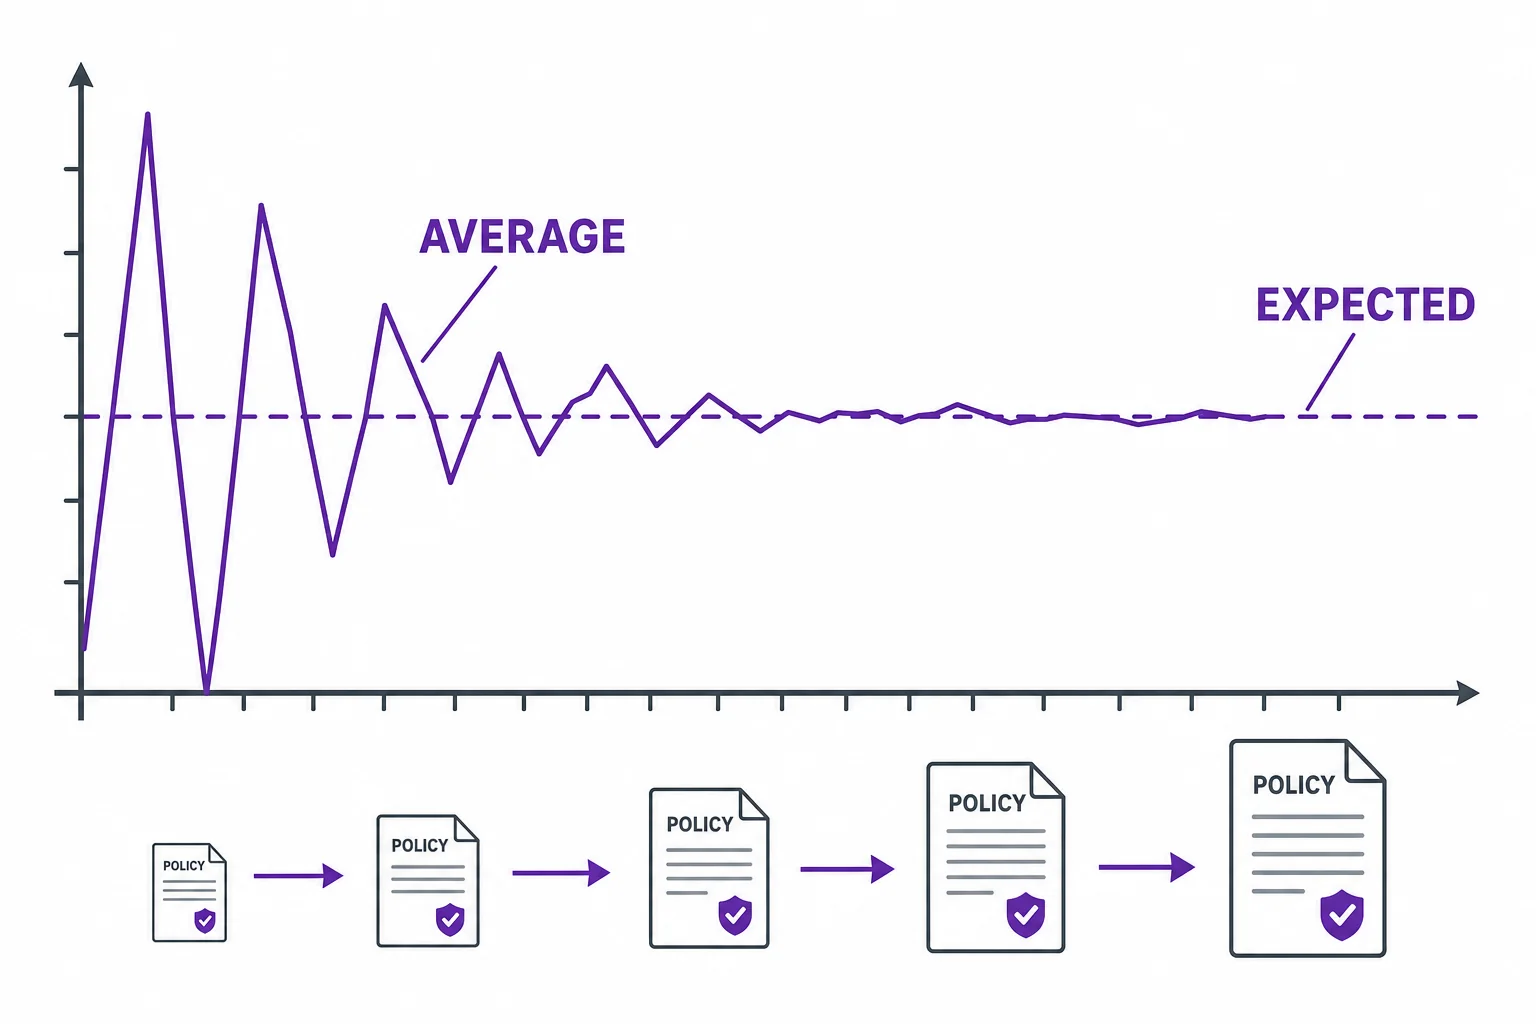
A graph showing average loss becoming more stable as the number of policies increases
More policies make the average less jumpy.
The law of large numbers says that as the number of similar trials grows, the sample average tends to get closer to the expected value. In insurance, each policy is one trial. A company with 10 policies may have a wild year. If two people file large claims, the average loss per policy can jump far above the plan. A company with 100,000 similar policies is different. The number of claims still changes from year to year, but the average loss is usually much closer to the predicted value. This does not remove risk. It reduces the relative size of random ups and downs. That is why insurers care so much about large pools of similar risks. More independent policies make the average more dependable.

Big pools make averages more predictable.

Premiums include a safety margin
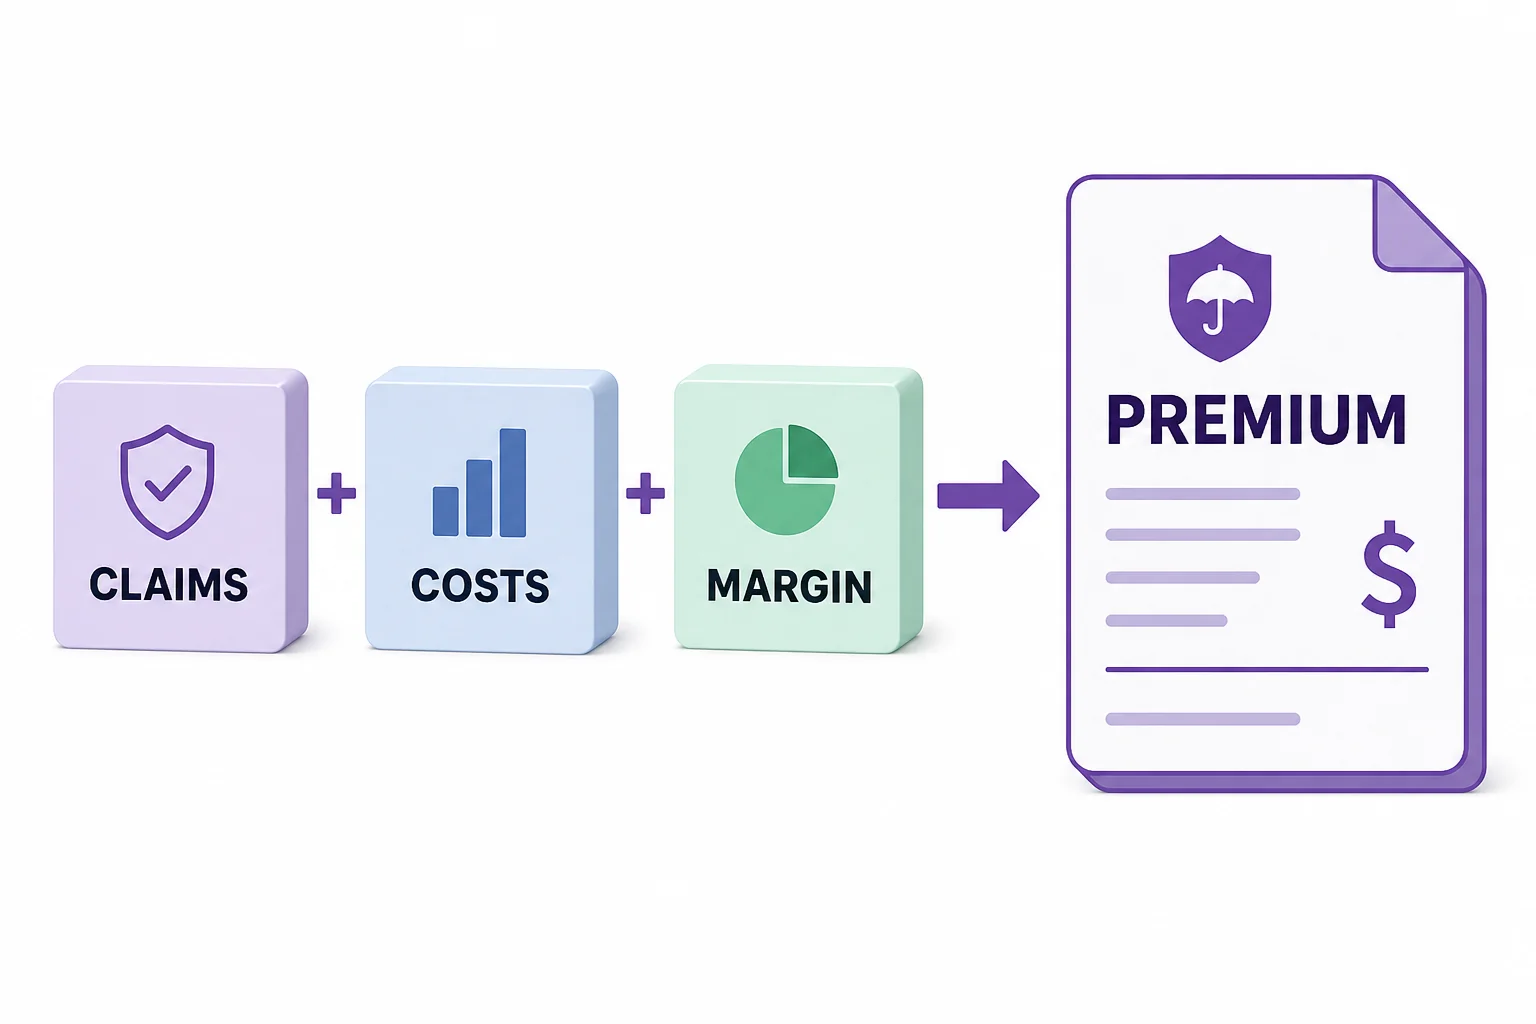
A flow diagram showing expected claims plus expenses plus risk margin adding up to a premium
A premium is more than the expected payout.
A fair price in probability is not always the price a company can charge and survive. If the expected claim cost is $\$100$, the premium must usually be more than $\$100$. The company needs money for ordinary expenses and for years that are worse than expected. It also needs reserves, which are funds set aside to pay future claims. A pricing model might look like $\text{premium} = \text{expected claims} + \text{expenses} + \text{risk margin} + \text{profit}$. The risk margin matters because real life is not a perfect classroom experiment. Drivers change behavior. Medical costs rise. Weather patterns shift. Fraud happens. Better data can improve the estimate, but it cannot make the future certain. The safety margin is part of why the company can stay solvent after bad years.

The margin protects the company from bad luck and bad estimates.

Winning is not guaranteed
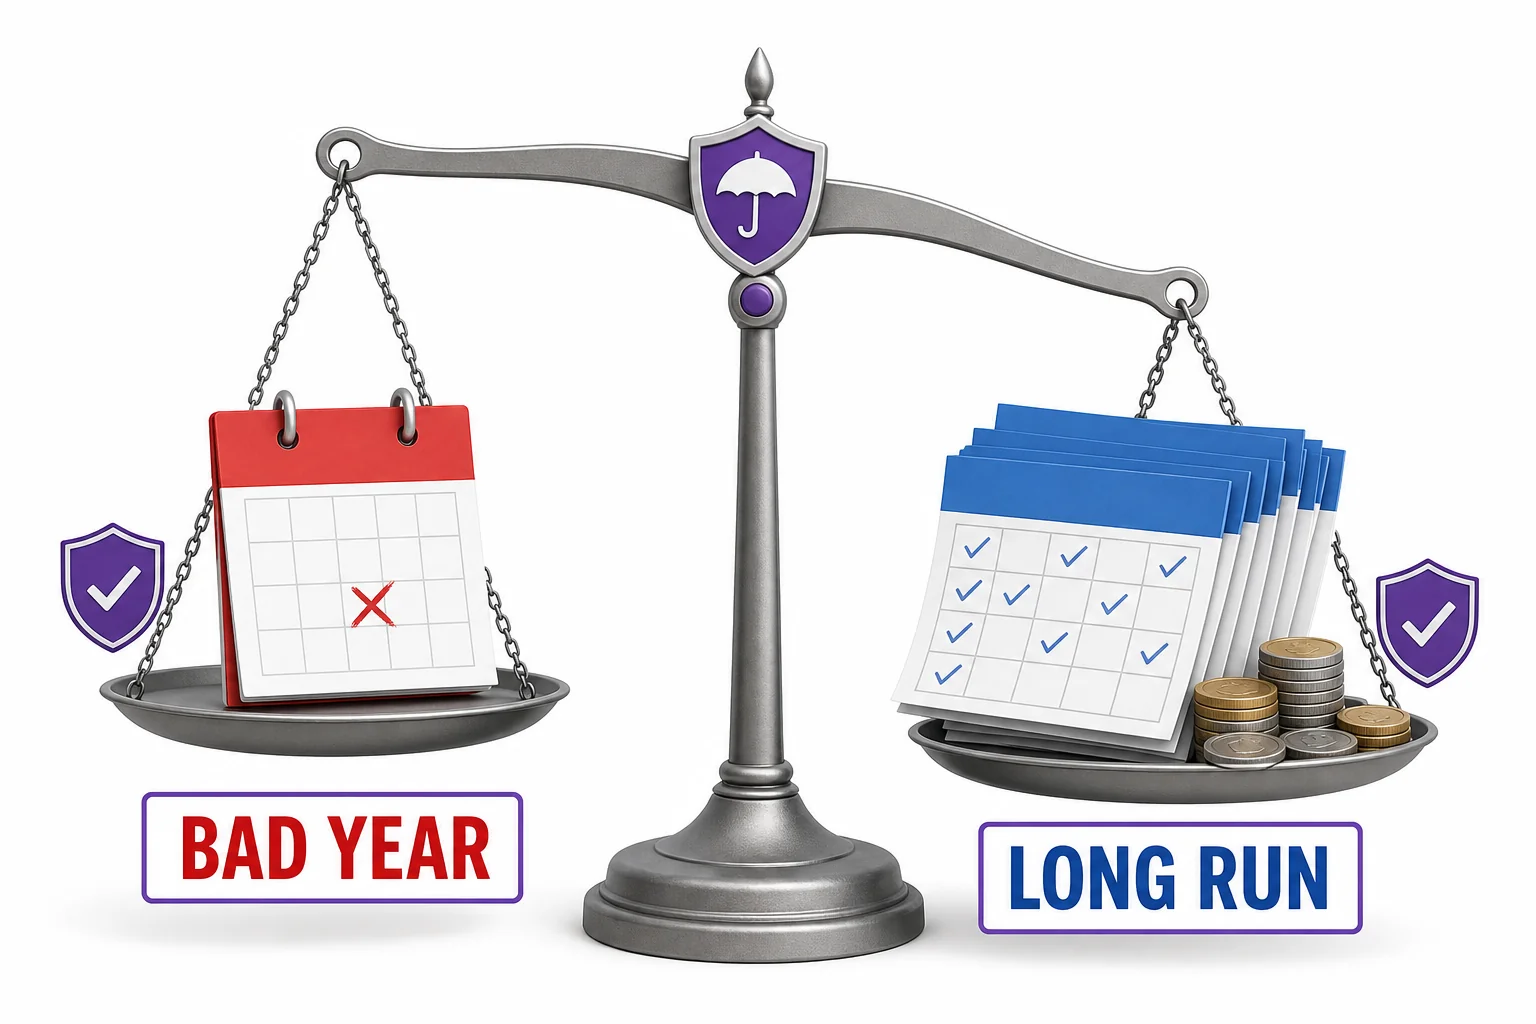
A balance scale comparing one bad year to many years with positive average results
Long-run profit depends on correct pricing and many policies.
Insurance companies do not always win every year. They can lose money if they underprice policies, misread a risk, face huge correlated losses, or invest reserves poorly. The phrase win in the long run means something more careful. If the pricing is accurate, the pool is large, and losses are not too connected, the average result should be positive over many policies and many years. This is the same logic that explains why a casino can lose money to one lucky player but still expect a profit across thousands of games. The math does not make the company invincible. It gives the company a positive expected value. For customers, the value is different. Insurance may have negative expected cash value, but it protects against losses too large for one person to handle.

Expected value is a plan, not a promise.

Vocabulary

Expected value
The long-run average result of a random process, found by weighting each outcome by its probability.
Premium
The amount a customer pays for an insurance policy.
Claim
A request for payment after a covered loss happens.
Law of large numbers
The rule that averages from many similar trials tend to get closer to the expected value.
Risk pool
A group of policyholders whose premiums and claims are combined.
Reserve
Money an insurer sets aside to pay future claims.

In the Classroom

Build a tiny insurance company

25 minutes | Grades 9-12

Students roll dice to simulate 100 drivers. A roll of 1 means a claim, and other rolls mean no claim. Students compare total claims with different premium prices.

Expected value pricing challenge

30 minutes | Grades 9-12

Groups receive loss amounts and probabilities for phone, car, or pet insurance. They compute expected claim cost, then add expenses and a risk margin to propose a premium.

Small pool versus large pool

40 minutes | Grades 9-12

Students simulate 10 policies, 100 policies, and 1,000 policies with a spreadsheet or random number generator. They graph the average loss per policy and connect the pattern to the law of large numbers.

Key Takeaways

  • Insurance companies use expected value to estimate average claim costs.
  • Premiums are set above expected claims to cover expenses, reserves, and profit.
  • One customer’s loss can be huge, but a large pool makes the average more stable.
  • The law of large numbers explains why many similar policies are easier to predict than one policy.
  • Insurers can still lose money if risks are priced badly or many claims happen together.