Practice interpreting normal distributions, calculating z-scores, and estimating probabilities for real-world situations.
Read each problem carefully. Show your work and write your final answer in a complete sentence when needed.
Using mean, standard deviation, and z-scores to find probabilities
Math - Grade 9-12
- 1
A test score distribution is normal with mean 70 and standard deviation 10. Find the z-score for a student who scored 85.
- 2
The heights of a group of plants are normally distributed with mean 24 cm and standard deviation 3 cm. Find the z-score for a plant that is 18 cm tall.
- 3
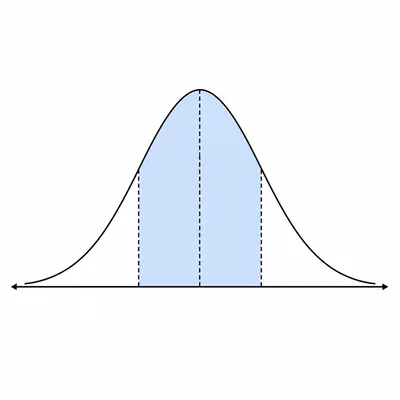
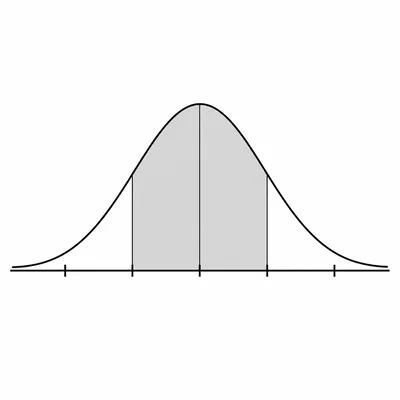
In a normal distribution, about what percent of data lies within 1 standard deviation of the mean?
- 4
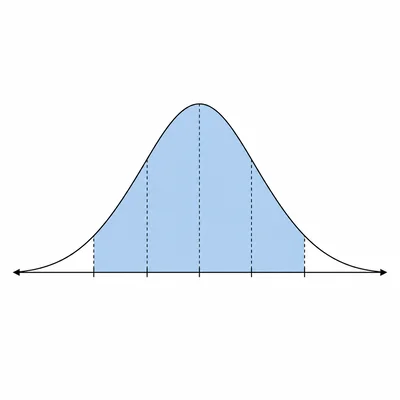
In a normal distribution, about what percent of data lies between 2 standard deviations below the mean and 2 standard deviations above the mean?
- 5
A normal distribution has mean 50 and standard deviation 8. What raw score corresponds to a z-score of 1.25?
- 6
A set of SAT practice scores is normally distributed with mean 500 and standard deviation 100. Using the empirical rule, estimate the probability that a randomly selected score is between 400 and 600.
- 7
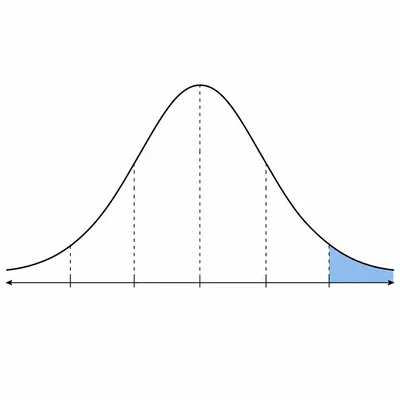
A normal distribution has mean 30 and standard deviation 5. Using the empirical rule, estimate the probability that a value is greater than 40.
- 8
The weights of boxes are normally distributed with mean 12 pounds and standard deviation 1.5 pounds. Find the z-score for a box weighing 13.5 pounds.
- 9
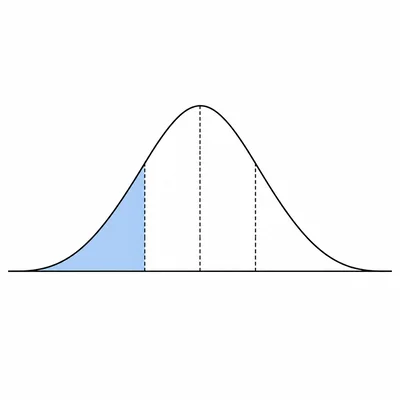
A normal distribution has mean 100 and standard deviation 15. Using the empirical rule, estimate the probability that a value is less than 85.
- 10
A data set is normal with mean 200 and standard deviation 20. What interval contains about 99.7 percent of the data?
- 11
The time it takes students to finish a quiz is normally distributed with mean 30 minutes and standard deviation 4 minutes. Estimate the probability that a student takes between 26 and 34 minutes.
- 12
A normal distribution has mean 75 and standard deviation 5. Find the raw score that is 2 standard deviations below the mean.
- 13
A standardized exam has scores that are normally distributed with mean 600 and standard deviation 80. Find the z-score for a score of 520.
- 14
A normal distribution has mean 40 and standard deviation 6. Using the empirical rule, estimate the probability that a value is between 34 and 52.
- 15
The diameters of machine-made bolts are normally distributed with mean 10 mm and standard deviation 0.2 mm. Using the empirical rule, estimate the probability that a bolt has a diameter between 9.8 mm and 10.2 mm.