Sign in to save

Bookmark this page so you can find it later.

Sign in to save

Bookmark this page so you can find it later.

Math high-school May 21, 2026

Why Do Quadratics Make Parabolas?

How a squared term shapes a curve

A coordinate grid showing several quadratic graphs opening upward and downward with their vertices marked.

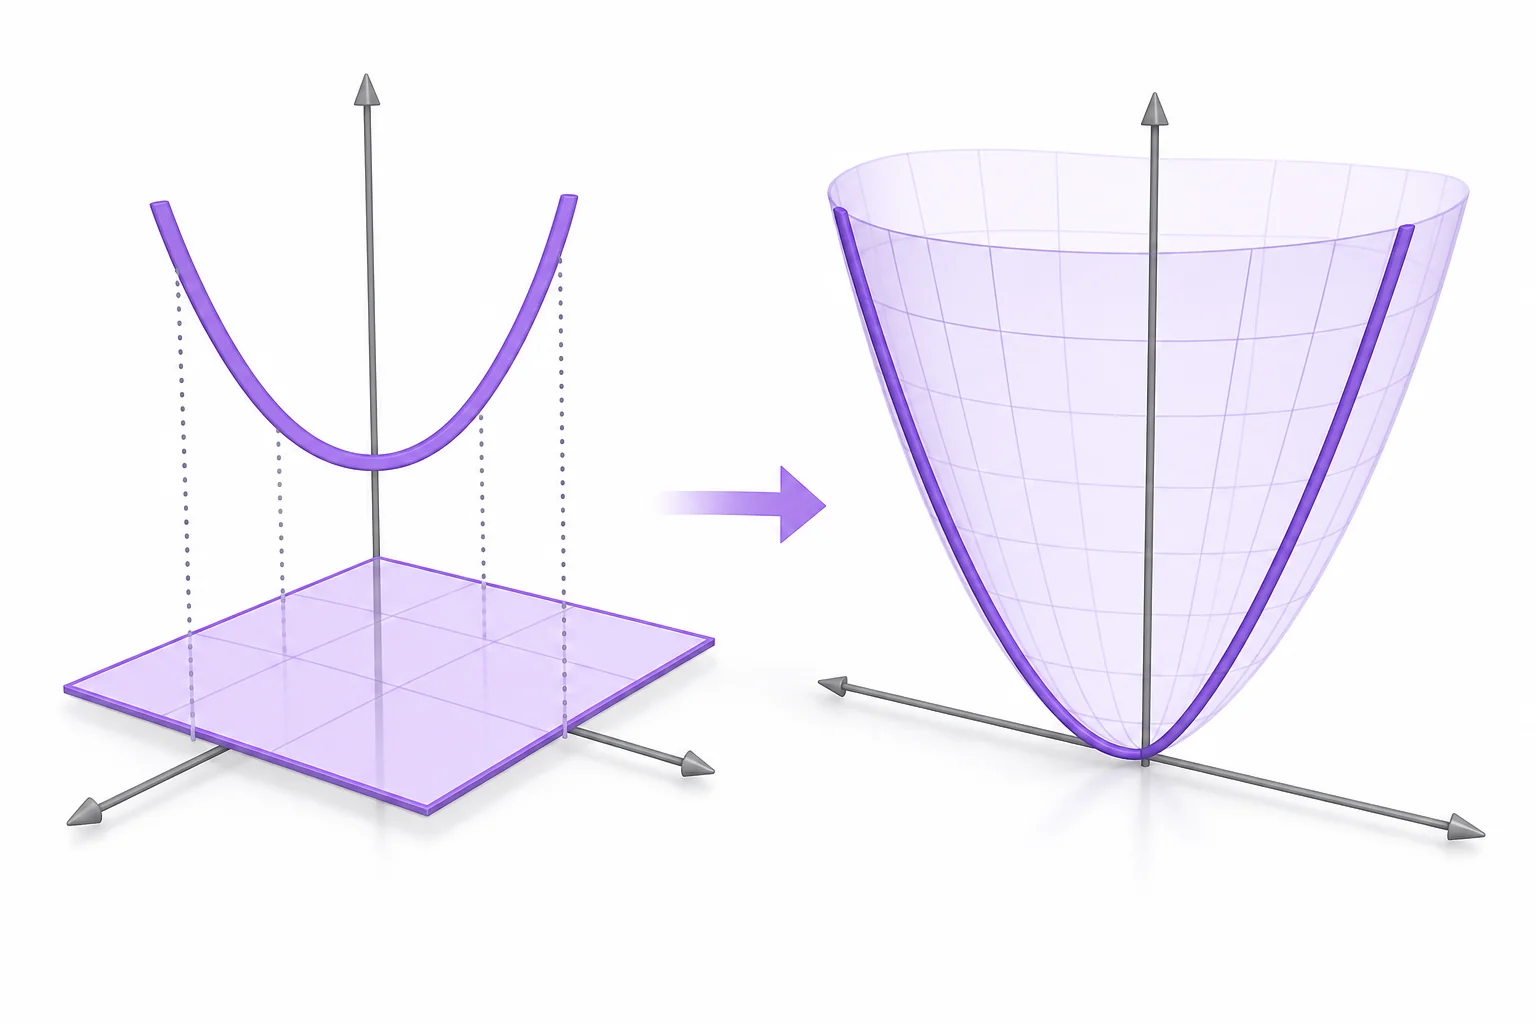
A quadratic makes a parabola because the squared term grows in a steady pattern on both sides of one point. That point is the vertex, where the graph turns around. The left and right sides match because squaring equal opposite numbers gives the same result.

Big Idea. Common Core HSA-REI.D.10 connects equations in two variables to the graphs of all their solutions.

Quadratic equations show up whenever a quantity depends on the square of another quantity. Their graphs are parabolas. That shape is not a drawing trick. It comes from how squared numbers grow. Move one step away from zero, and $x^2$ is 1. Move two steps away, and $x^2$ is 4. Move three steps away, and $x^2$ is 9. The outputs rise faster because the inputs are being multiplied by themselves. A quadratic can shift, stretch, flip, and slide, but the same pattern stays underneath. This matters in algebra, graphing, and motion. A ball in the air follows a path that can be modeled by a quadratic when air resistance is ignored. You can test the shape by graphing points with a tool like the LivePhysics graphing calculator or by comparing equations in a classroom table.

Squares grow in a pattern

A coordinate grid showing the graph of y equals x squared with plotted points at x values from negative three to three.
The outputs match on both sides of zero.
Start with the simplest quadratic, $y=x^2$. Make a table with matching negative and positive inputs. When $x=-3$, the output is 9. When $x=3$, the output is also 9. The same match happens for -2 and 2, and for -1 and 1. This happens because a negative number times itself becomes positive. The graph rises on both sides of zero. It rises slowly near zero and faster as $|x|$ gets larger. That increasing rate is why the curve bends instead of forming a straight line. A linear equation adds the same amount each time. A quadratic adds a growing amount. On the graph, that growing amount appears as a smooth U-shaped curve. The curve has one lowest point for $y=x^2$, and that point is at the origin.

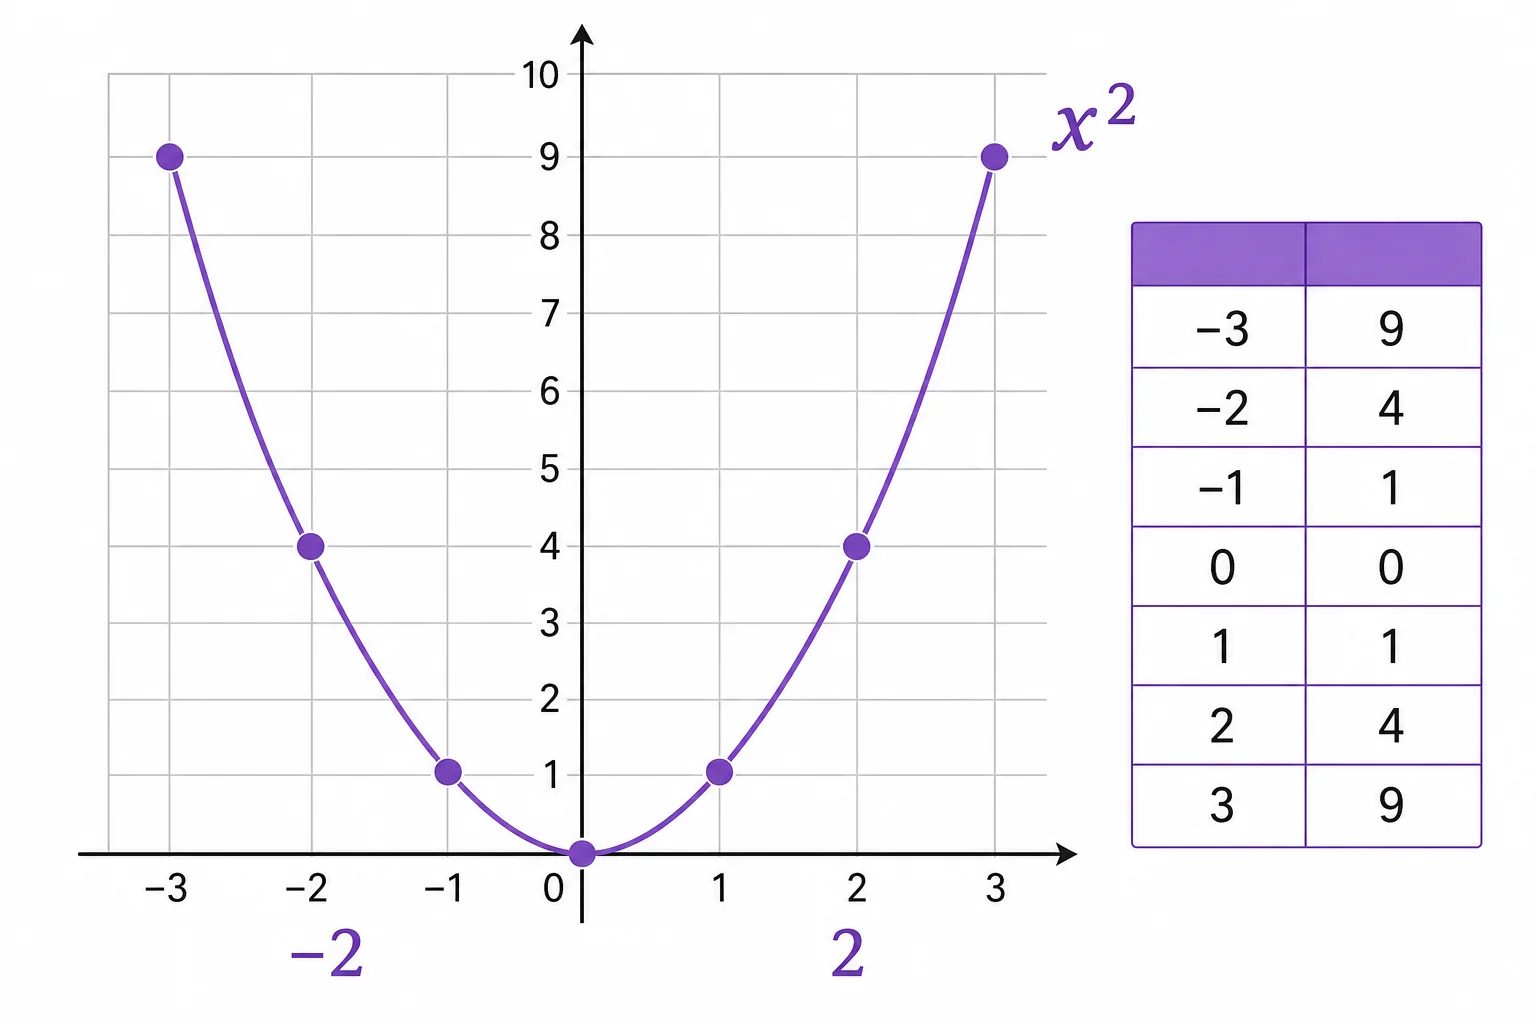
A squared input makes equal outputs for opposite x-values.

The vertex is the turn

A coordinate grid showing a shifted upward-opening parabola with its vertex labeled and horizontal and vertical shifts indicated.
Vertex form shows where the graph turns.
A parabola has a turning point called the vertex. In the basic graph $y=x^2$, the vertex is $(0,0)$. The graph decreases as it moves toward the vertex from the left, then increases as it moves away to the right. Vertex form makes this turn easy to see. The equation $y=a(x-h)^2+k$ has vertex $(h,k)$. The value of $h$ moves the graph left or right. The value of $k$ moves it up or down. The number $a$ changes how wide the graph is and whether it opens up or down. If $a$ is positive, the parabola opens upward. If $a$ is negative, it opens downward. The squared part still builds the same curve around the vertex. That is why many different-looking quadratic equations still make parabolas.

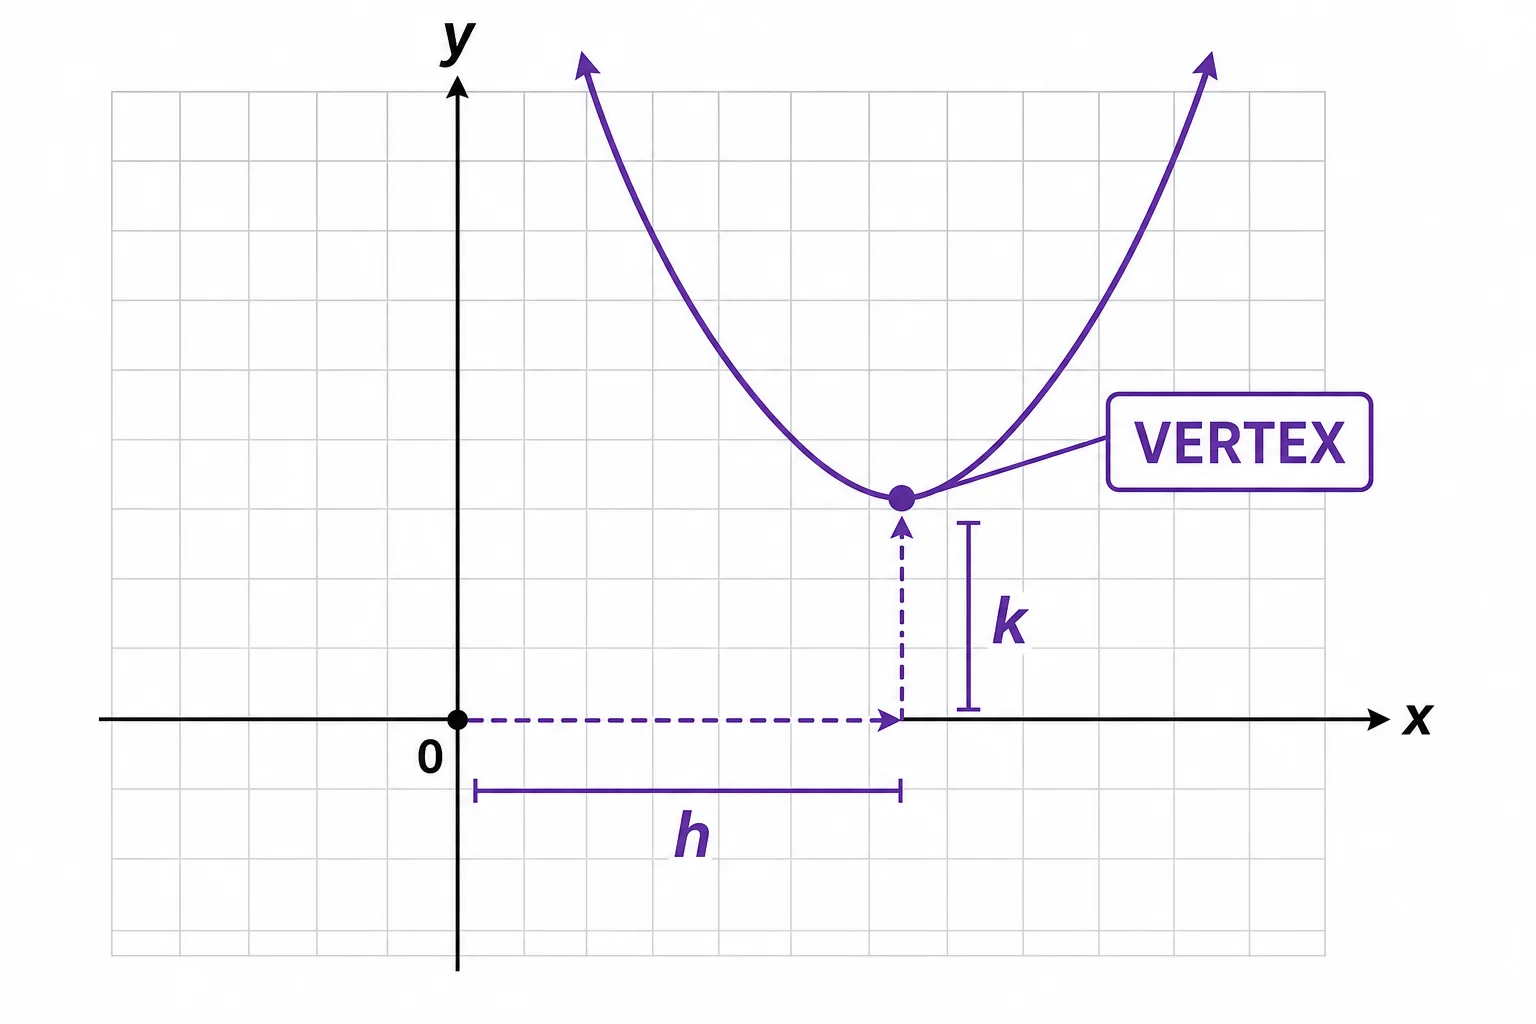
Vertex form separates the turn point from the shape change.

Symmetry comes from squaring

A parabola with a vertical line of symmetry through its vertex and matching points on the left and right sides.
Equal distances from the center give equal heights.
Every parabola has a line of symmetry. For $y=x^2$, that line is the y-axis. Points the same distance left and right of the y-axis have the same height. In vertex form, the line of symmetry is $x=h$. The reason is built into the expression $(x-h)^2$. If one input is 4 units to the right of $h$ and another is 4 units to the left of $h$, both become 16 after squaring. The graph mirrors across the vertical line through the vertex. This symmetry helps when solving quadratic equations. If a horizontal line crosses a parabola in two places, those points sit the same distance from the line of symmetry. That connection supports graphing by hand and checking solutions found with algebra.

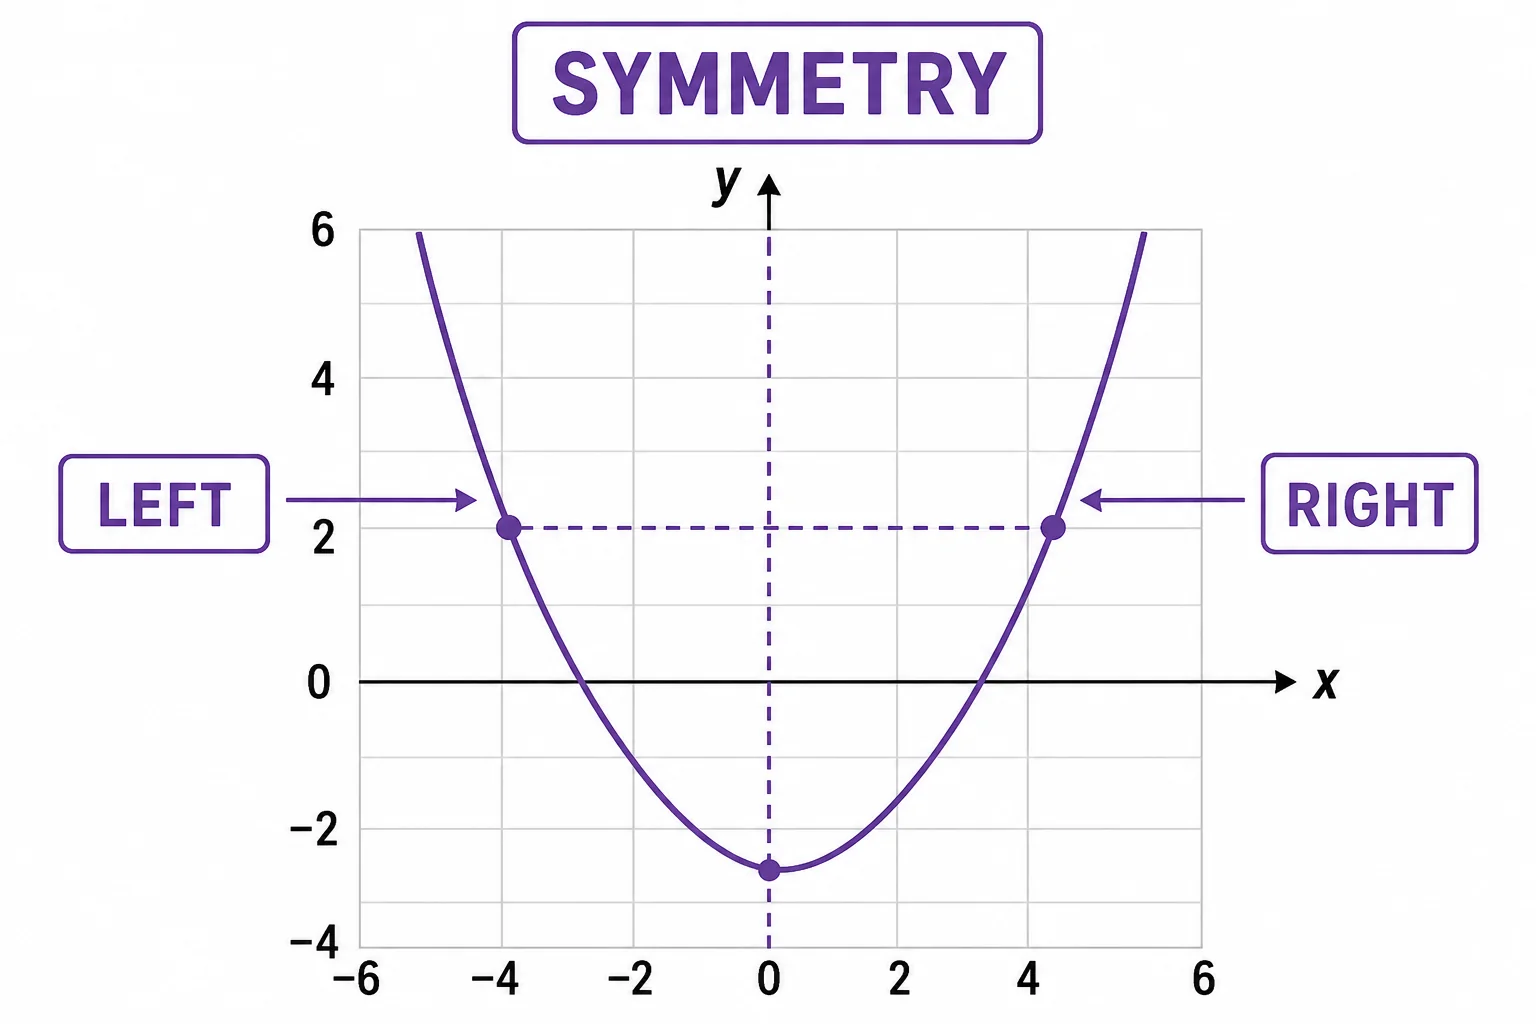
The mirror shape comes from equal opposite distances being squared.

The coefficient controls width

Three parabolas on the same coordinate grid showing narrow, standard, and wide shapes caused by different values of the coefficient a.
Changing a changes the width and direction.
The coefficient on the squared term changes how quickly the outputs grow. In $y=ax^2$, the number $a$ multiplies every squared value. If $a=2$, each output is twice as large as it would be in $y=x^2$. The graph becomes narrower because it reaches higher values faster. If $a=\frac{1}{2}$, the outputs are half as large. The graph becomes wider because it rises more slowly. If $a$ is negative, every output is reflected across the x-axis. The parabola opens downward instead of upward. These changes do not stop the graph from being a parabola. They stretch, compress, or flip the same squared-number pattern. This is useful when modeling real situations because the coefficient can represent how strong the effect is.

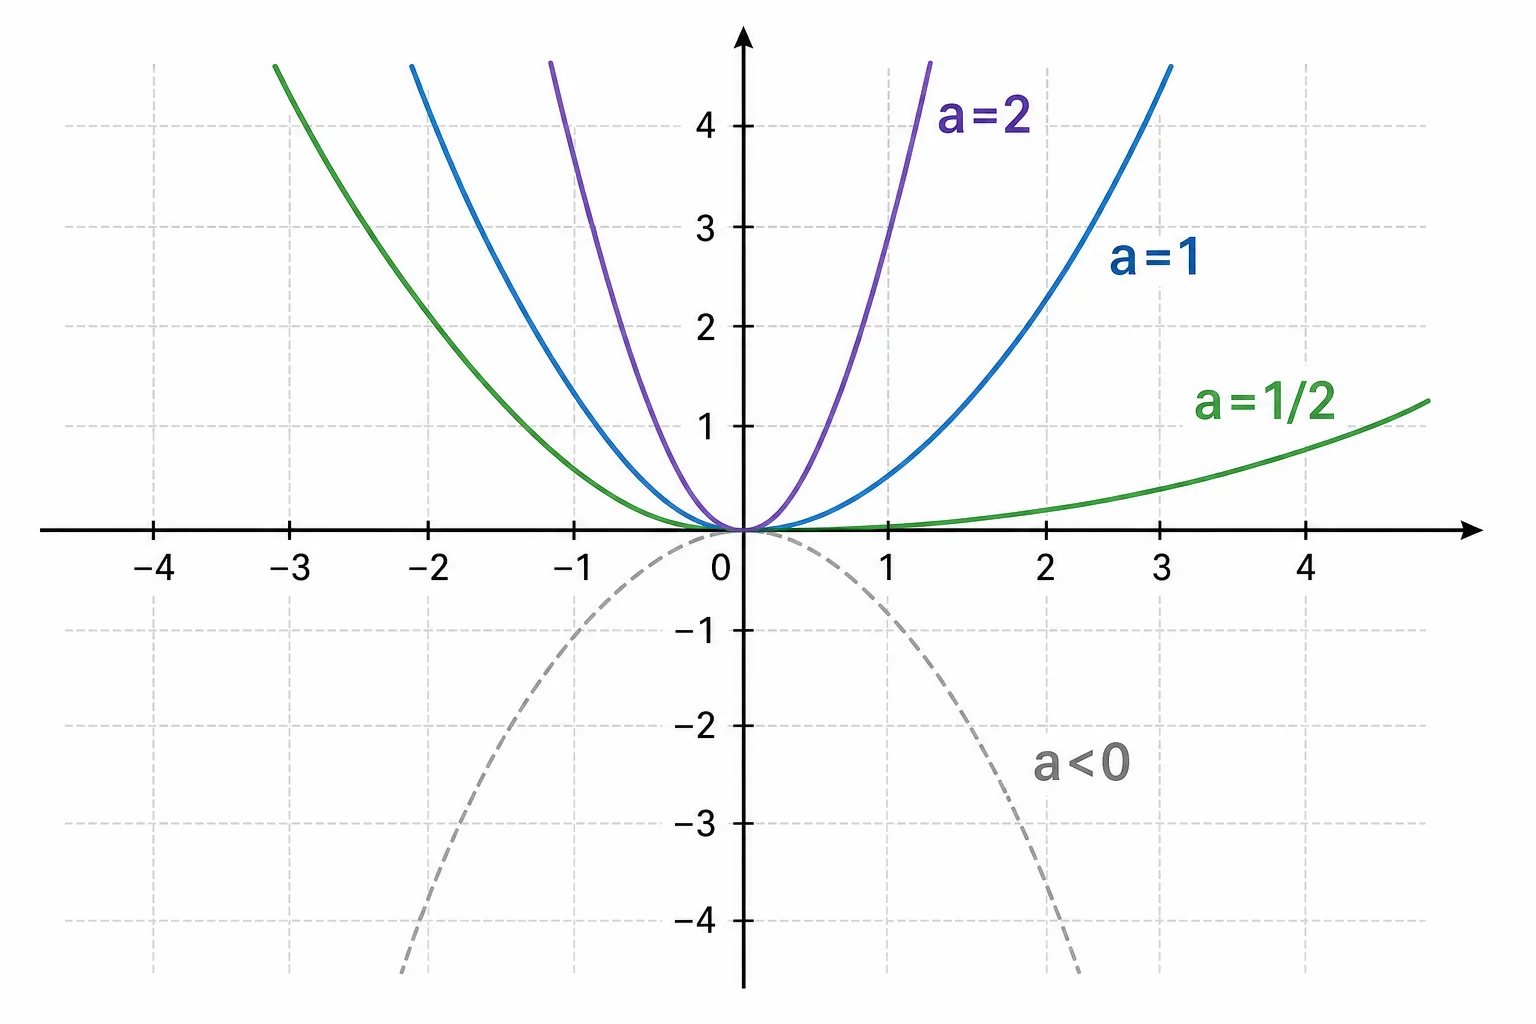
The sign and size of a control the opening of the parabola.

Projectiles trace parabolas

A ball following a downward-opening parabolic path with equal time positions marked along the arc and a height-time graph beside it.
A quadratic can model height over time.
Quadratics are not only abstract graphs. They also model projectile motion when gravity is constant and air resistance is small enough to ignore. A thrown ball moves forward while gravity pulls it downward. Its horizontal motion can be modeled as steady. Its vertical position changes with time because gravity changes vertical speed at a steady rate. That steady change leads to a squared time term. The height can be modeled with an equation like $h(t)=-16t^2+v_0t+h_0$ in feet. The negative squared term makes the graph open downward. The vertex gives the maximum height. The two sides of the graph describe rising and falling. In real life, wind and spin can change the path, but the quadratic model is a strong first approximation.

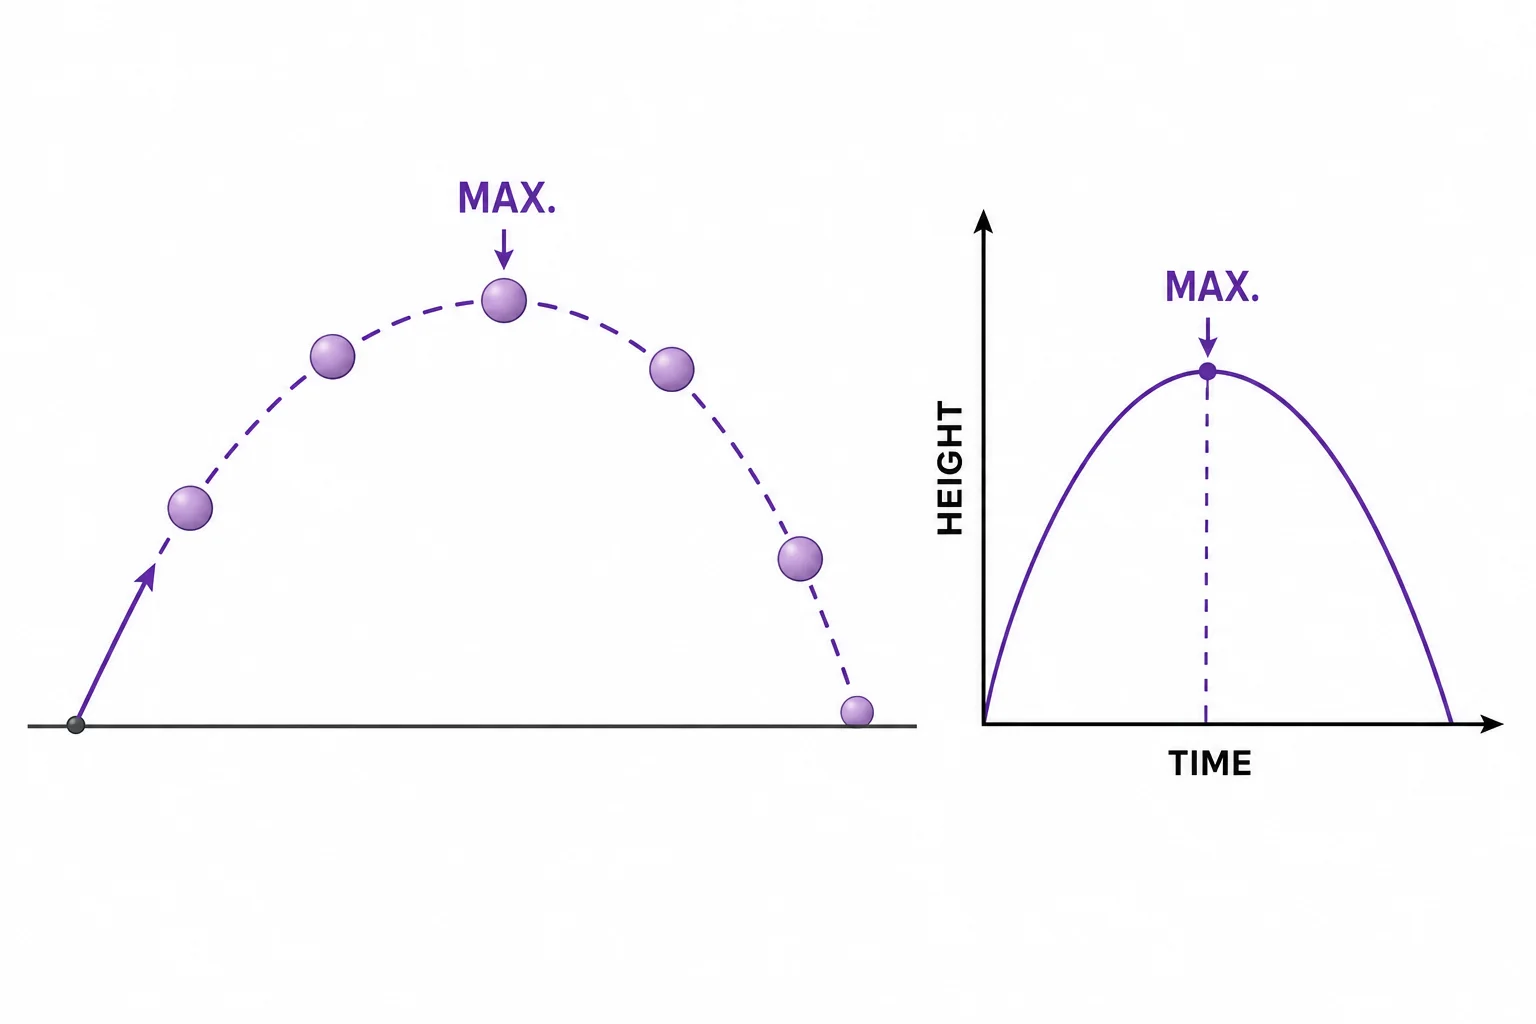
Constant gravity gives projectile height a squared-time term.

Vocabulary

Quadratic
A polynomial equation or function whose highest power of the variable is 2.
Parabola
The U-shaped graph made by a quadratic function.
Vertex
The turning point of a parabola, where it reaches a minimum or maximum value.
Axis of symmetry
The vertical line that splits a parabola into two matching halves.
Coefficient
A number that multiplies a variable expression, such as the a in $y=ax^2$.
Projectile motion
The motion of an object moving through the air while gravity changes its vertical speed.

In the Classroom

Build the table, then graph

20 minutes | Grades 9-10

Students make a table for $y=x^2$ using inputs from -5 to 5. They plot the points, connect the curve, and explain why the left and right sides match.

Vertex form matching

25 minutes | Grades 9-11

Give students cards with equations in vertex form and cards with graphs. Students match each equation to its graph and identify the vertex, opening direction, and width.

Projectile data model

30 minutes | Grades 10-12

Students watch a short video or use sample data for the height of a thrown ball over time. They sketch a quadratic model and use the vertex to estimate the maximum height.

Key Takeaways

  • Quadratics make parabolas because squared values grow in a curved pattern.
  • Opposite inputs can have the same squared value, which creates symmetry.
  • The vertex is the turning point of the parabola.
  • Vertex form $y=a(x-h)^2+k$ shows shifts, width, and direction.
  • Projectile height can often be modeled by a downward-opening quadratic.