Curve Sketching Explorer
Pick a function and the explorer walks through the full curve sketching process. It locates critical points where the first derivative is zero, classifies each as a local maximum or minimum with the second derivative test, marks inflection points where concavity changes, and shows the intervals where the function increases, decreases, curves up, and curves down.
Choose a function
Analysis summary
Critical points
- x = -1, f(x) = 2 local maximum
- x = 1, f(x) = -2 local minimum
Increasing on
(-3, -1) ∪ (1, 3)Decreasing on
(-1, 1)Inflection points
- x = 0, f(x) = 0
Concave up on
(0, 3)Concave down on
(-3, 0)How Curve Sketching Works
The First Derivative and Where a Function Rises or Falls
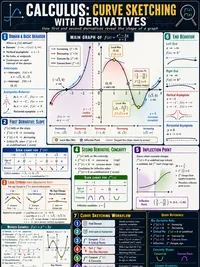
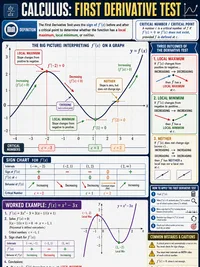
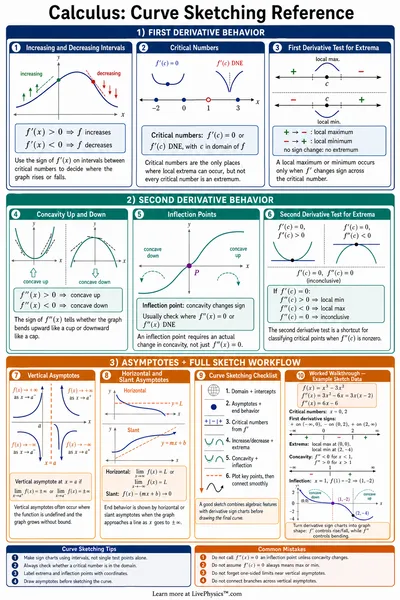
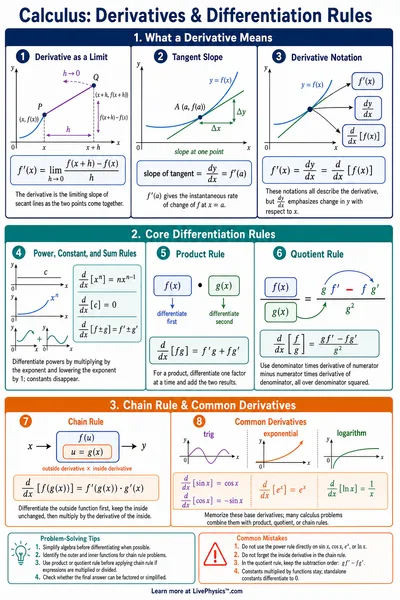
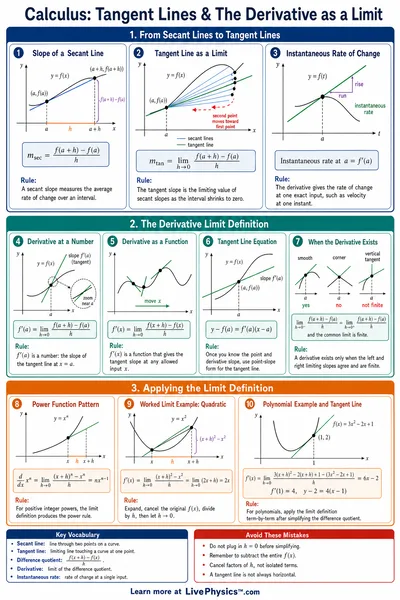
The first derivative f′(x) measures the slope of the curve at each point. Where f′(x) is positive, the function is increasing. Where f′(x) is negative, the function is decreasing.
The points where f′(x) equals zero are called critical points. These are the candidates for local high points and low points, because the slope is momentarily flat there.
The first derivative test classifies a critical point by looking at how the sign of f′ changes around it. If f′ goes from positive to negative, the point is a local maximum. If it goes from negative to positive, it is a local minimum.
The Second Derivative Test for Maxima and Minima
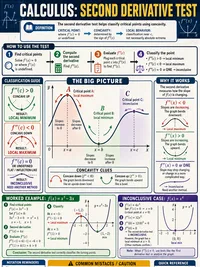
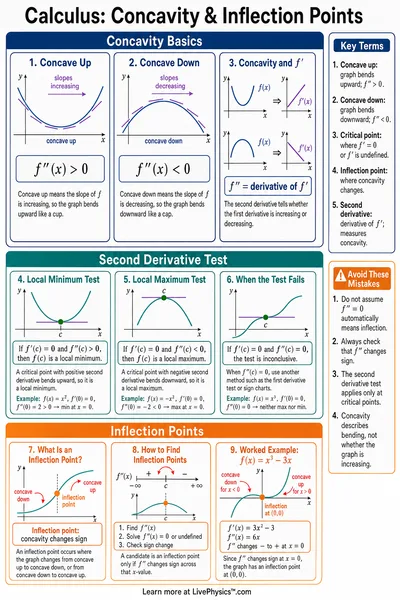
The second derivative f″(x) describes how the slope itself is changing. At a critical point where f′(x) is zero, the second derivative gives a quick verdict.
If f″(x) is greater than zero, the curve is opening upward at that point, so it is a local minimum. If f″(x) is less than zero, the curve is opening downward, so it is a local maximum.
When f″(x) equals zero at a critical point the test is inconclusive, and you fall back on the first derivative test. The function f(x) = x³ shows this case. Its only critical point at x = 0 is neither a maximum nor a minimum.
Concavity and Inflection Points
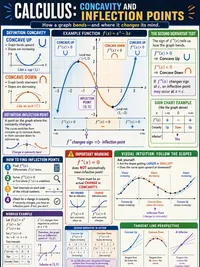
Concavity tells you which way the curve bends. Where f″(x) is positive the graph is concave up and holds water like a cup. Where f″(x) is negative the graph is concave down like a dome.
An inflection point is a place where concavity changes, that is, where f″(x) switches sign. The curve straightens out for an instant and then bends the other way.
Finding f″(x) equal to zero is only the first step. You must confirm that the sign actually flips across that point. The explorer shades concave up regions lightly so the change of bending is easy to see next to each open circle marker.
The Full Curve Sketching Checklist
A complete sketch comes from gathering the pieces in order, then drawing the curve that fits all of them at once.
- Compute f′(x) and solve f′(x) = 0 for critical points.
- Use the sign of f′ to find increasing and decreasing intervals.
- Apply the second derivative test to label each maximum or minimum.
- Compute f″(x) and find where it changes sign for inflection points.
- Use the sign of f″ to find concave up and concave down intervals.
- Plot the marked points and connect them following the slope and bending.
Toggle the f′ and f″ overlays in the tool to watch how the zeros of each derivative line up with the features on f(x).