Practice turning science data into bar graphs, labeling graphs, and using graphs to answer questions.
Read each problem carefully. Use the data to make or understand bar graphs. Show your work in the space provided.
Organize and compare science observations with bar graphs
Science - Grade 2-3
- 1
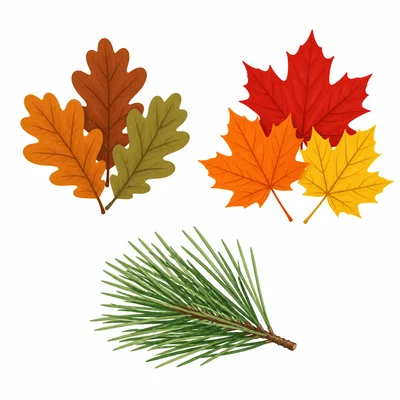
A class counted the number of leaves they found on a nature walk. Oak leaves: 6. Maple leaves: 4. Pine needles: 3. Draw a bar graph to show the data. Be sure to include a title and labels.
- 2
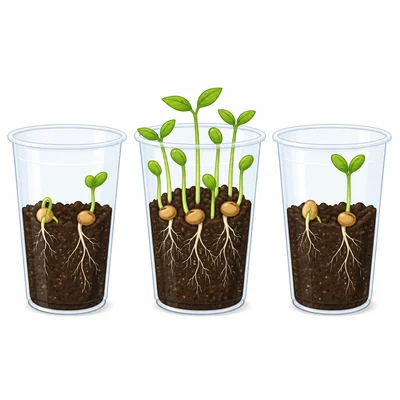
A science group measured how many seeds sprouted in three cups. Cup A: 5 seeds. Cup B: 8 seeds. Cup C: 6 seeds. Which cup should have the tallest bar on a bar graph?
- 3
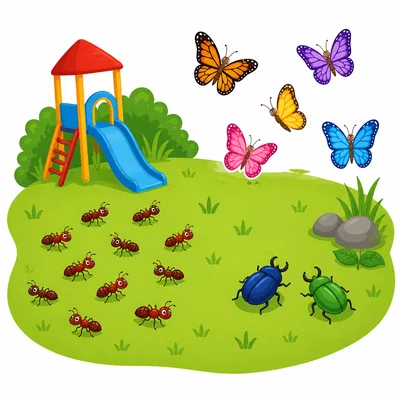
Look at this data about insects found near the playground. Ants: 9. Beetles: 2. Butterflies: 4. How many more ants were found than butterflies?
- 4
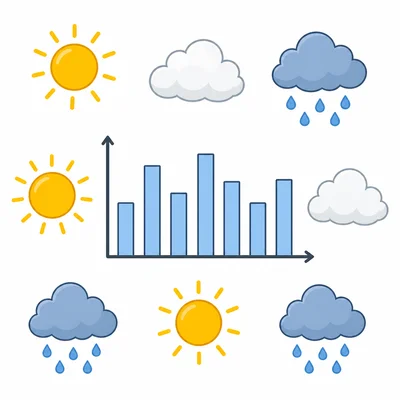
A student made a bar graph about weather for one week. Sunny: 3 days. Cloudy: 2 days. Rainy: 2 days. What is a good title for this bar graph?
- 5
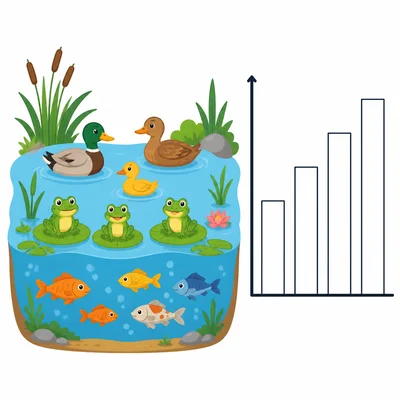
Use the data to complete a bar graph about animal sightings at a pond. Ducks: 7. Frogs: 5. Fish: 3. Which label should go on the side that shows the height of each bar?
- 6
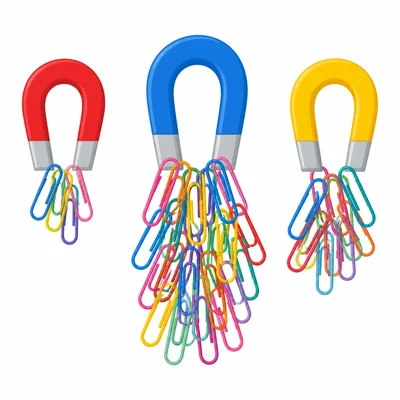
A class tested how many paper clips different magnets could pick up. Magnet 1 picked up 4 paper clips. Magnet 2 picked up 10 paper clips. Magnet 3 picked up 6 paper clips. Draw a bar graph for the data.
- 7
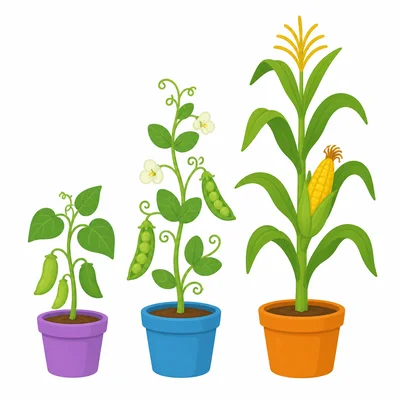
A bar graph shows plant heights. Bean plant: 8 cm. Pea plant: 5 cm. Corn plant: 9 cm. Which plant was the shortest?
- 8
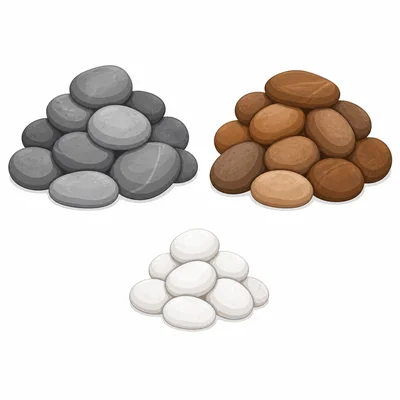
A science chart shows how many rocks students sorted by color. Gray rocks: 6. White rocks: 3. Brown rocks: 6. If you make a bar graph, which two bars will be the same height?
- 9
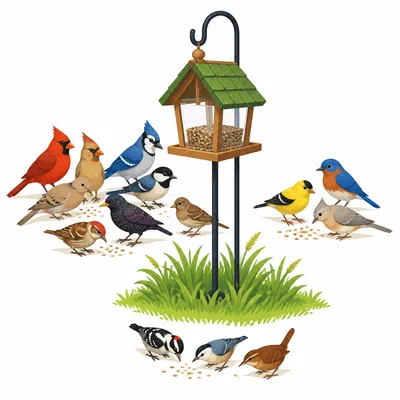
A class recorded the number of birds seen at a feeder. Monday: 4 birds. Tuesday: 7 birds. Wednesday: 5 birds. On which day were the most birds seen?
- 10
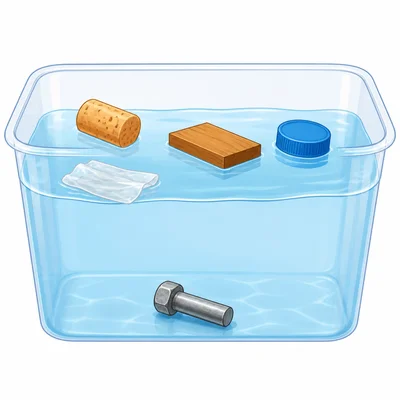
Use this data about materials that floated in water. Cork: 8 pieces. Wood: 6 pieces. Plastic: 4 pieces. Metal: 0 pieces. Draw a bar graph and show that metal had no pieces that floated.
- 11
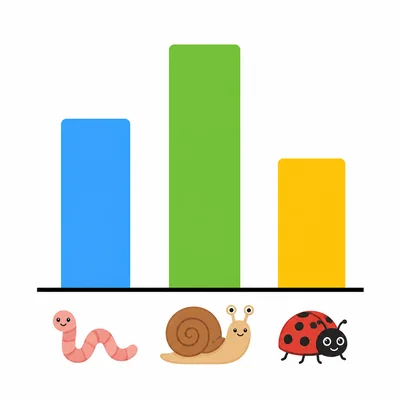
A student made a bar graph with a title and bars, but forgot to label the bottom. The data categories are worm, snail, and ladybug. What label could go at the bottom of the graph?
- 12
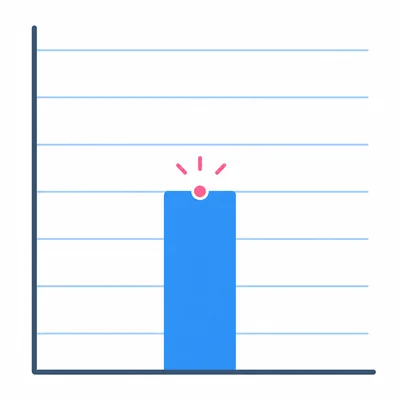
A bar graph uses a scale that counts by 2s: 0, 2, 4, 6, 8, 10. If a bar reaches halfway between 6 and 8, what number does it show?
- 13
A class counted shells found at the beach. Small shells: 8. Medium shells: 5. Large shells: 2. Write two sentences that tell what the bar graph would show.