Practice AP Microeconomics concepts related to consumer choice, utility maximization, budget constraints, and the demand curve.
Read each problem carefully. Show your work in the space provided and explain your reasoning when asked.
Utility, budget constraints, and demand curves
Social Studies - Grade 9-12
- 1
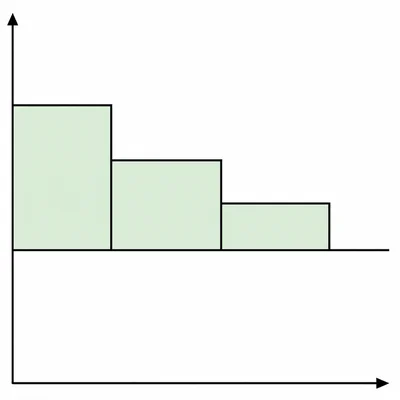
A student gets total utility from slices of pizza as follows: 0 slices = 0 utils, 1 slice = 18 utils, 2 slices = 32 utils, 3 slices = 42 utils, 4 slices = 48 utils, and 5 slices = 50 utils. Find the marginal utility of the 4th slice and explain whether marginal utility is diminishing.
- 2
A consumer is choosing between tacos and sodas. A taco costs $2 and has a marginal utility of 10 utils. A soda costs $1 and has a marginal utility of 6 utils. Based on marginal utility per dollar, which good should the consumer buy more of at the current bundle?
- 3
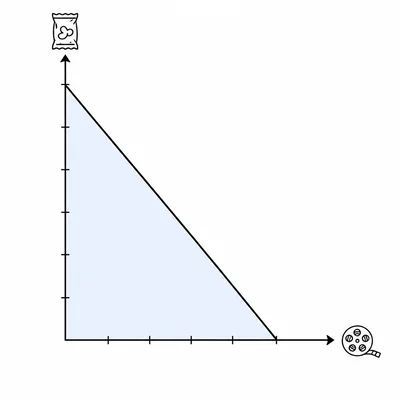
A consumer has $24 to spend on movies and snacks. Movies cost $8 each and snacks cost $4 each. Write the budget constraint, find the maximum number of movies, find the maximum number of snacks, and state the opportunity cost of 1 movie in terms of snacks.
- 4
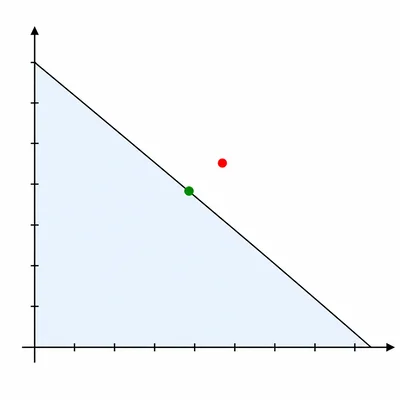
A consumer has $30 to spend on good X and good Y. Good X costs $5 and good Y costs $3. Determine whether the bundle with 4 units of X and 4 units of Y is affordable. Then determine whether the bundle with 3 units of X and 5 units of Y is affordable.
- 5
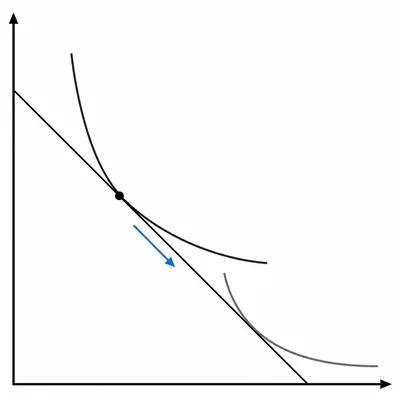
At a certain bundle, a consumer is willing to give up 3 units of good Y to get 1 more unit of good X while staying equally satisfied. The price of X is $4 and the price of Y is $2. Should the consumer buy more X, buy more Y, or stay at the current bundle to maximize utility?
- 6
A consumer has $10. Apples cost $2 each and bananas cost $1 each. Marginal utility per dollar values are: apples 10, 8, 6, 4, 2 for the first through fifth apples; bananas 10, 8, 6, 4, 2, 1 for the first through sixth bananas. What bundle maximizes utility if the consumer spends all $10?
- 7
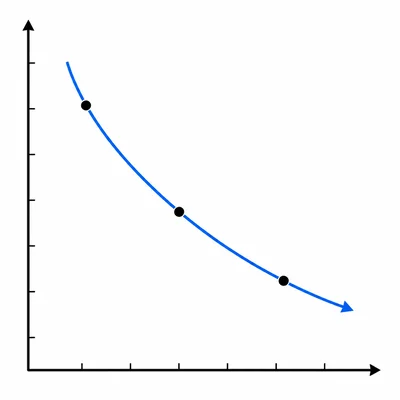
Explain how the law of demand can be derived from consumer choice when the price of a good falls, assuming all else stays constant.
- 8
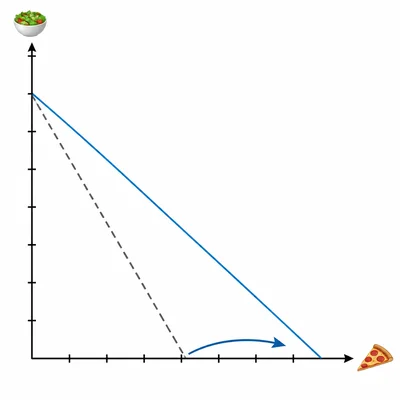
A consumer has $40 to spend on pizza and salad. Pizza originally costs $10 and salad costs $8. Then the price of pizza falls to $5 while the price of salad stays the same. Describe how the budget line changes.
- 9
When income rises, a student's demand for bus rides falls and demand for restaurant meals rises. Classify each good as normal or inferior and explain your classification.
- 10
Three consumers have the following quantities demanded of a product. At a price of $5, Ana demands 2 units, Ben demands 1 unit, and Cara demands 0 units. At a price of $3, Ana demands 5 units, Ben demands 4 units, and Cara demands 2 units. Find the market quantity demanded at each price.
- 11
A consumer is willing to pay $20 for the first concert ticket, $16 for the second ticket, and $12 for the third ticket. If the market price is $10 per ticket and the consumer buys 3 tickets, calculate total consumer surplus.
- 12
The price of printer ink rises. Explain what is likely to happen to the demand for printers if printers and ink are complements.
- 13
The price of a good falls from $10 to $8, and quantity demanded rises from 50 units to 70 units. Use the midpoint method to calculate the price elasticity of demand and state whether demand is elastic or inelastic.
- 14
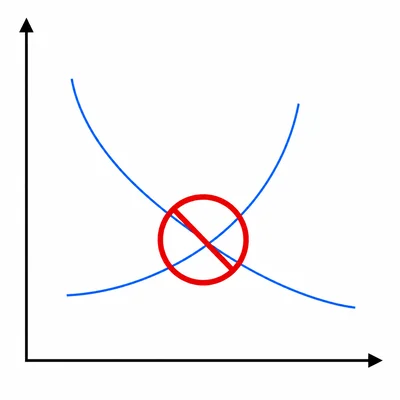
Explain why two indifference curves for the same consumer cannot cross.
- 15
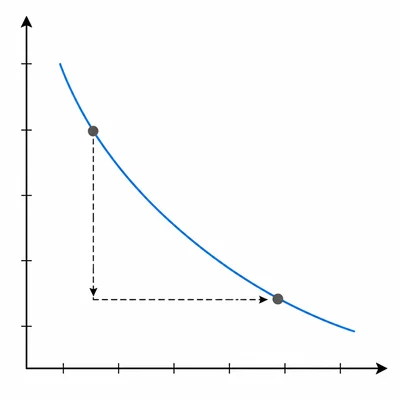
A consumer's optimal quantity of a good is 2 units when the price is $6, 3 units when the price is $4, and 5 units when the price is $2. Use these points to describe the consumer's demand curve.