Inflation Basket & CPI Simulator
A price index tracks the cost of a fixed basket of goods over time. Choose what goes in the basket, set how fast each price changes, and see the Consumer Price Index, the yearly inflation rate, and what a fixed amount of money is really worth.
Build your basket
| Good | Quantity / yr | Base price ($) | Annual change (%) | |
|---|---|---|---|---|
A negative annual change models a falling price, such as electronics that get cheaper over time.
Projection settings
CPI and purchasing power over time
Base year basket cost (2015)
$21,865
Cumulative inflation by 2025
44.6%
Real value of $1,000 in 2025
$691.66
Year by year
| Year | Basket cost | CPI | Inflation | Value of $1,000 |
|---|---|---|---|---|
| 2015 (base) | $21,865 | 100.0 | n/a | $1,000 |
| 2016 | $22,669.57 | 103.7 | 3.68% | $964.51 |
| 2017 | $23,507.91 | 107.5 | 3.70% | $930.11 |
| 2018 | $24,381.44 | 111.5 | 3.72% | $896.79 |
| 2019 | $25,291.61 | 115.7 | 3.73% | $864.52 |
| 2020 | $26,239.94 | 120.0 | 3.75% | $833.27 |
| 2021 | $27,228.03 | 124.5 | 3.77% | $803.03 |
| 2022 | $28,257.54 | 129.2 | 3.78% | $773.78 |
| 2023 | $29,330.19 | 134.1 | 3.80% | $745.48 |
| 2024 | $30,447.79 | 139.3 | 3.81% | $718.11 |
| 2025 | $31,612.22 | 144.6 | 3.82% | $691.66 |
Reading a Price Index
What a CPI basket is and why the base year is 100
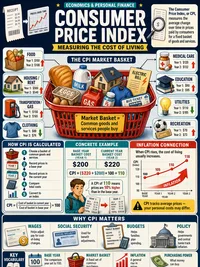
A Consumer Price Index follows the total cost of the same fixed basket of goods from year to year. The basket stays the same so that any change in cost comes from prices, not from buying more or less.
Economists pick one year as the base year and set its index to 100. Every later year is measured against it. A CPI of 110 means the basket costs 10% more than it did in the base year.
How to read an inflation rate
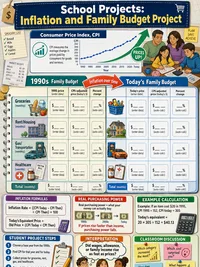
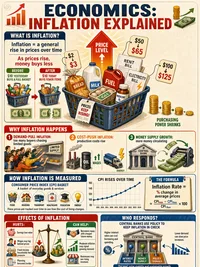
The inflation rate is the percent change in the CPI from one year to the next. If the CPI goes from 110 to 113.3, the inflation rate for that year is about 3%.
Cumulative inflation is the total rise since the base year. The two are different. A steady 3% each year still adds up to a much larger cumulative figure over a decade because each year builds on the last.
Real value versus nominal value
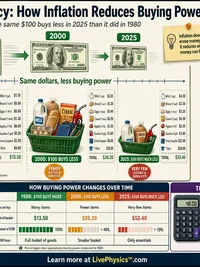
A nominal amount is the dollar figure printed on the bill. Its real value is what that money can actually buy. As prices rise, the same nominal amount buys less, so its real value falls.
To find the real value, divide by the CPI and multiply by 100. At a CPI of 125, a fixed $100 buys what $80 did in the base year. This tool draws that falling purchasing power right next to the rising index.
How to use this tool
Pick a preset basket or edit the rows directly. Set a quantity, a base price, and an annual change for each good, then choose how many years to project.
- Goods that rise faster pull the whole index up more.
- A negative annual change models a falling price.
- Use Share this scenario to send your basket to someone else.