Understanding Wealth Growth Lab
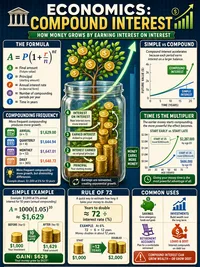
Each year in a wealth model has a beginning balance, money added during the year, investment change, and costs removed. The ending balance becomes the next year's beginning balance. This repeated update is an iterative process, a useful idea across applied mathematics.
When deposits happen matters. A contribution made near the start of a year can earn returns for almost that whole year, while one made near the end has less time. A careful simulation states its timing rule before comparing results.
Models often use one average annual return because it makes patterns easier to see. Real investments rise and fall by different amounts, so the order of good and bad years can change the outcome. This matters most when someone begins taking money out.
An employer match is usually limited by a rule, rather than given on every dollar saved. A workplace might match part of contributions up to a share of pay. Students should calculate the matched amount separately before adding it to the account.
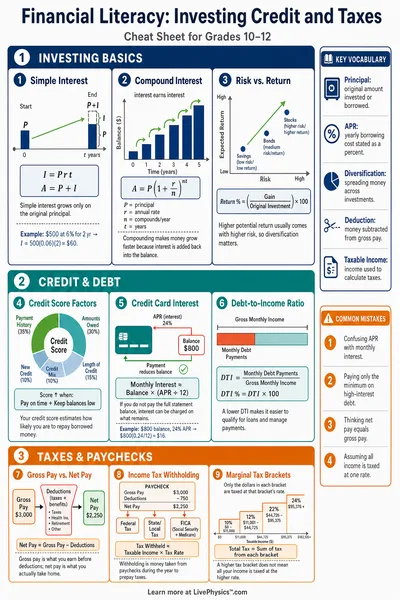
Fees are often charged as a percentage of the account value each year. Their dollar amount grows as the account grows, which makes them more damaging later. In a spreadsheet, subtract the fee after calculating that year's investment gain, using one consistent rule.
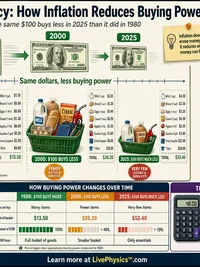
Inflation changes what a future balance can buy. A large number of future dollars may pay for less food, housing, or education than the same number today. To estimate purchasing power, divide the future balance by the cumulative inflation factor.
For rough work, a real return can be estimated by subtracting the inflation rate from the investment return. A more precise calculation accounts for the fact that both rates compound. The difference is small at low rates but becomes clearer over several decades.
Starting earlier does more than add extra deposits. It gives the first deposits many more rounds of growth, and it may capture more matched money. A late starter can sometimes contribute more each year, yet catching up can require a surprisingly high amount.
A fair comparison changes one input at a time. Keep income, contribution schedule, return assumption, and time period fixed when testing fees or starting age. Otherwise, the results cannot show which factor caused the difference.
Saving as a percentage of pay is often more realistic than saving one fixed dollar amount forever. Pay may rise over time, though real careers include gaps, job changes, and unequal earnings. A model is an estimate, not a promise about a person's future.
Tables reveal yearly changes that a final total can hide. Graphing balances over time helps students notice when growth begins to outweigh new contributions. Check that every row uses the previous row's ending balance, since one wrong cell can distort thirty years.
A final balance is not the only result worth studying. Compare total personal deposits, total employer money, investment gains, fees paid, and purchasing power. These categories show where the money came from and explain why two similar plans can end very differently.