Practice reading tables and graphs, finding patterns in data, and explaining what those patterns mean.
Read each problem carefully. Look for trends, repeated changes, outliers, and relationships. Show your work in the space provided.
Use tables and graphs to spot trends, outliers, and relationships in data
CS - Grade 6-8
- 1
A fitness app records the number of steps taken each day: Monday 4,200, Tuesday 4,800, Wednesday 5,300, Thursday 5,900, Friday 6,400. Describe the pattern in the data.
- 2
A table shows the number of website visitors each hour: 8 AM 12, 9 AM 18, 10 AM 25, 11 AM 33, 12 PM 41. What is the general trend, and what might it mean?
- 3
A class tracked the number of recycled bottles collected each week: Week 1 40, Week 2 42, Week 3 39, Week 4 95, Week 5 43. Which value looks like an outlier, and why?
- 4
A game records a player's score after each level: Level 1 120, Level 2 240, Level 3 360, Level 4 480. If the pattern continues, what will the score be after Level 5?
- 5
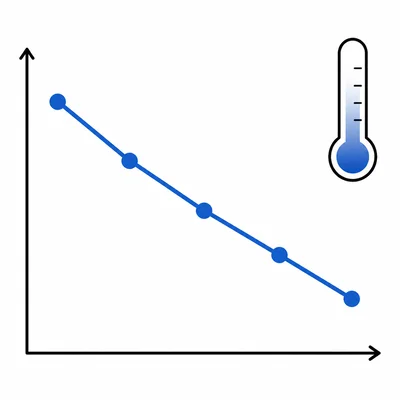
A line graph shows the temperature at noon over five days: Monday 70°F, Tuesday 68°F, Wednesday 65°F, Thursday 62°F, Friday 60°F. Describe the trend shown by the graph.
- 6
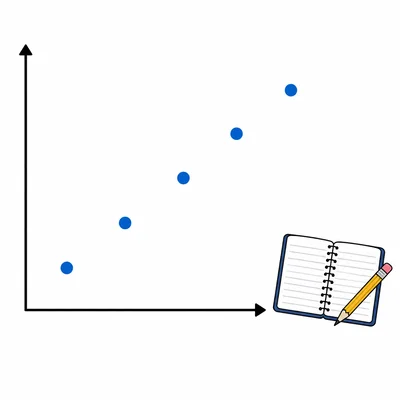
A data table shows how long students studied and their quiz scores: 10 minutes 62, 20 minutes 70, 30 minutes 78, 40 minutes 86, 50 minutes 94. What relationship do you notice?
- 7
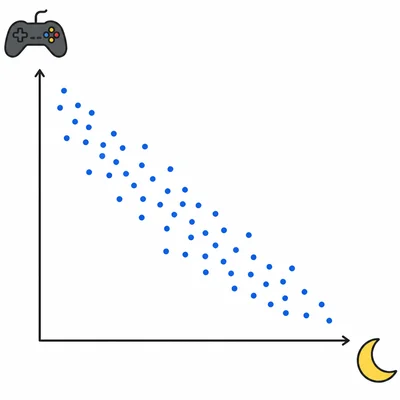
A scatter plot compares hours of video game play per week and hours of sleep per night. Most points show that students who play more hours tend to sleep fewer hours. What type of relationship is this?
- 8
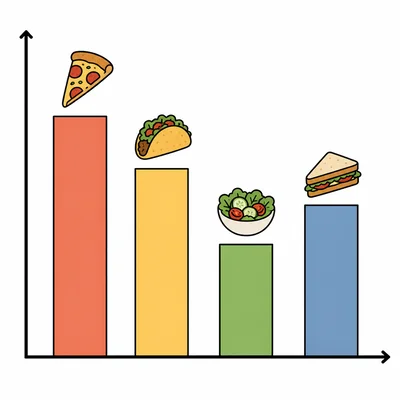
A school cafeteria records lunch choices for one day: Pizza 85, Tacos 60, Salad 25, Sandwich 45. Which graph type would best compare the number of students choosing each lunch, and why?
- 9
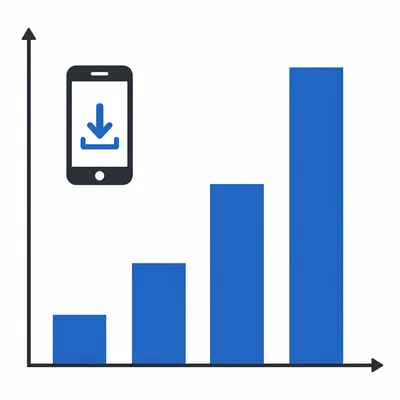
A table shows daily app downloads: Day 1 15, Day 2 30, Day 3 60, Day 4 120. Describe the pattern and predict Day 5.
- 10
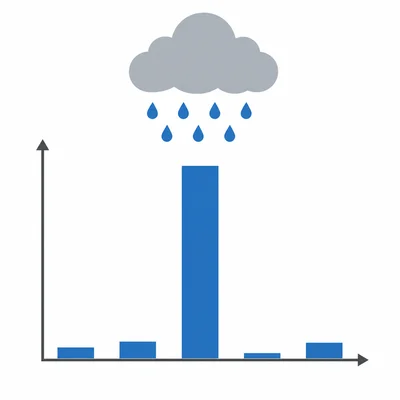
A weather dataset lists rainfall in inches: Monday 0.0, Tuesday 0.1, Wednesday 1.8, Thursday 0.0, Friday 0.2. Which day had the most rainfall, and how does it compare to the rest of the week?
- 11
A data scientist finds this pattern in a table: 3, 6, 9, 12, 15. What rule describes the pattern?
- 12
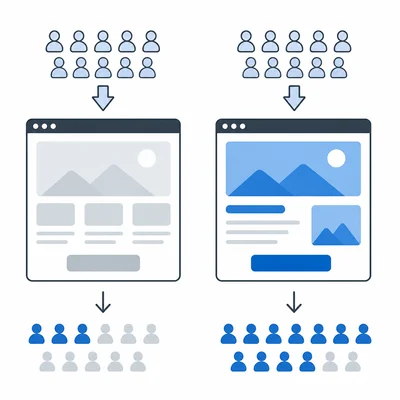
A website tests two homepage designs. Design A gets 200 visits and 40 sign-ups. Design B gets 200 visits and 60 sign-ups. Which design performed better, and what evidence supports your answer?
- 13
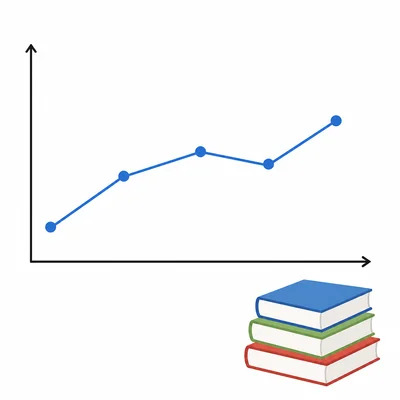
A chart shows the number of books checked out from a library by month: January 120, February 125, March 130, April 128, May 132. What pattern do you notice?
- 14
A table tracks a robot's distance from its starting point every second: 0 seconds 0 meters, 1 second 2 meters, 2 seconds 4 meters, 3 seconds 6 meters, 4 seconds 8 meters. What does this pattern tell you about the robot's movement?
- 15
A data table has a missing value: Week 1 5 points, Week 2 10 points, Week 3 15 points, Week 4 blank, Week 5 25 points. What is the most likely missing value, and how do you know?