Practice reading data tables, choosing labels, drawing bars, and checking bar graphs for accuracy.
Read each data table carefully. Create or complete each bar graph. Label your graph and show your work in the space provided.
Turn data tables into clear bar graphs
Math - Grade 2-3
- 1
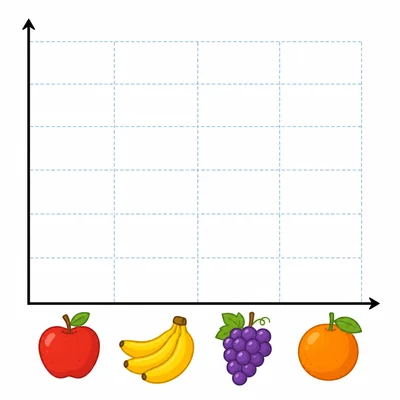
Use the data table to make a bar graph. Favorite fruits: Apples 5, Bananas 3, Grapes 4, Oranges 2. Label the bottom Fruit and the side Number of Students.
- 2
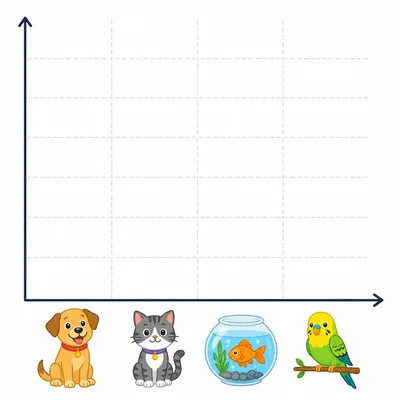
Use the data table to make a bar graph. Pets in our class: Dogs 6, Cats 4, Fish 2, Birds 1. Give your graph a title.
- 3
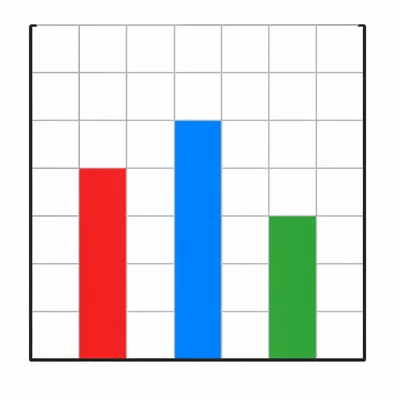
A student made a bar graph from this table. Favorite colors: Red 4, Blue 7, Green 3. The student drew Red at 4, Blue at 5, and Green at 3. Which bar needs to be fixed, and how?
- 4
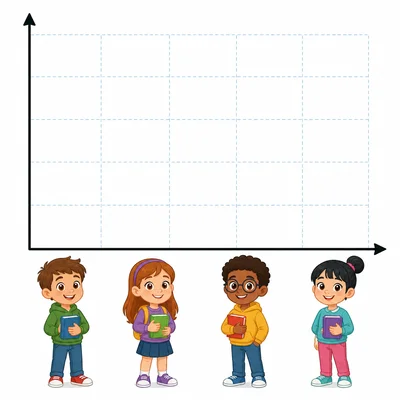
Use the data table to make a bar graph. Books read this week: Ana 3, Ben 5, Cara 2, Dion 4. Label each bar with the student's name.
- 5
Look at the table. Stickers earned: Monday 2, Tuesday 4, Wednesday 6, Thursday 3. What number should the tallest bar reach when you make the bar graph?
- 6
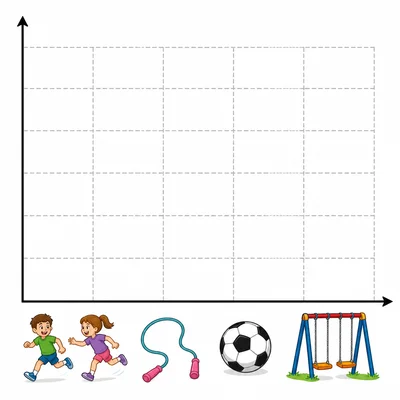
Use the data table to make a bar graph. Playground games: Tag 8, Jump rope 5, Soccer 6, Swings 4. Use a scale that counts by 1.
- 7
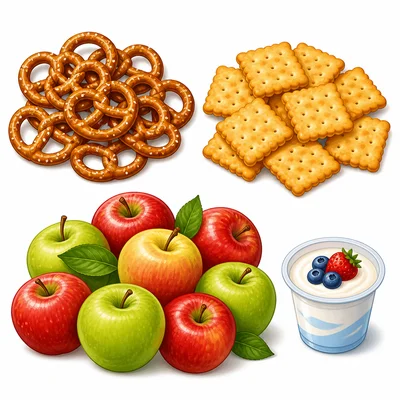
Use the data table to make a bar graph. Snacks sold: Pretzels 4, Crackers 4, Apples 6, Yogurt 2. Which two bars should be the same height?
- 8
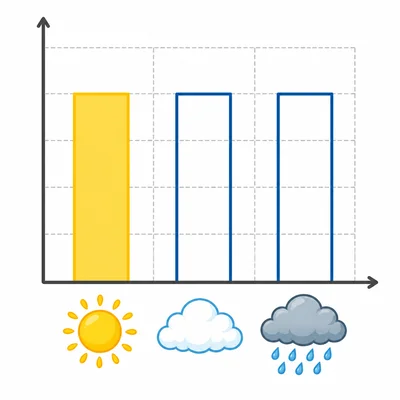
Complete the bar graph from the table. Weather days: Sunny 5, Cloudy 3, Rainy 2. The Sunny bar is already drawn to 5. Draw the Cloudy and Rainy bars.
- 9
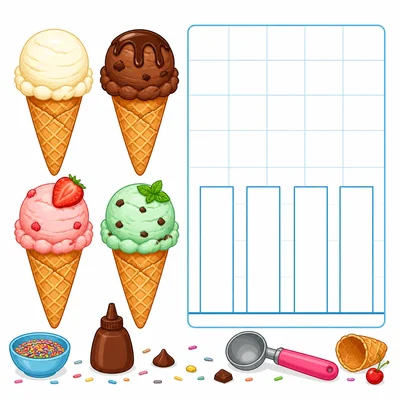
Use the data table to make a bar graph. Favorite ice cream flavors: Vanilla 3, Chocolate 7, Strawberry 4, Mint 2. What title would fit this graph?
- 10
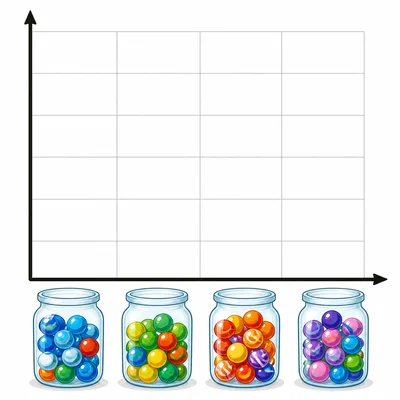
Use the data table to make a bar graph. Marbles in jars: Jar A 2, Jar B 5, Jar C 1, Jar D 4. Label the bottom Jars and the side Number of Marbles.
- 11
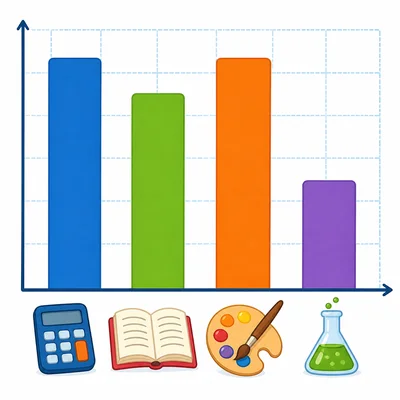
A class table shows Favorite school subjects: Math 6, Reading 5, Art 6, Science 3. When you make the bar graph, which bars should be tallest?
- 12
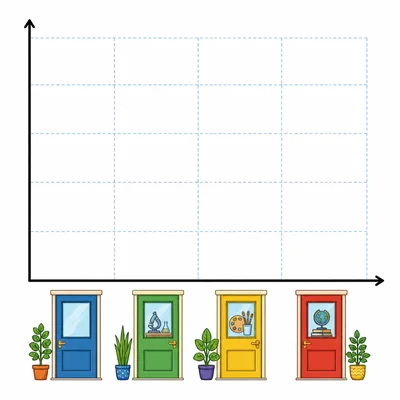
Use the data table to make a bar graph. Number of plants: Room 1 has 4, Room 2 has 2, Room 3 has 5, Room 4 has 3. Write one sentence that tells what your graph shows.
- 13
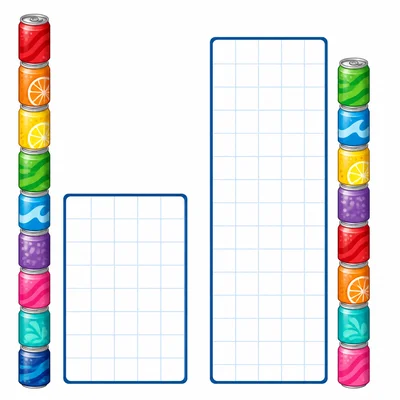
Choose the best scale for a bar graph with this table. Cans recycled: Monday 2, Tuesday 4, Wednesday 6, Thursday 8. Should the side scale go to 5 or to 8? Explain.
- 14
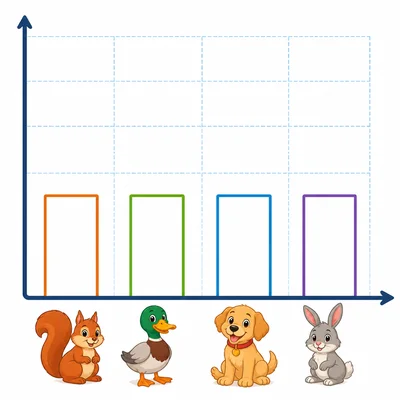
Use the data table to make a bar graph. Animals seen at the park: Squirrels 7, Ducks 3, Dogs 5, Rabbits 1. Make sure the bars are not touching.
- 15
Check this bar graph plan for the table. Favorite drinks: Water 5, Juice 4, Milk 2. Plan: title Favorite Drinks, bottom label Drinks, side label Number of Students, Water bar 5, Juice bar 4, Milk bar 2. Is the plan correct? Explain.