Students practice collecting simple data about favorite things and showing the data with tally marks, picture graphs, and simple bar graphs.
Read each problem carefully. Count the votes or pictures. Show your work in the space provided.
Practice asking questions, counting answers, and making simple graphs
Math - Grade K-1
- 1
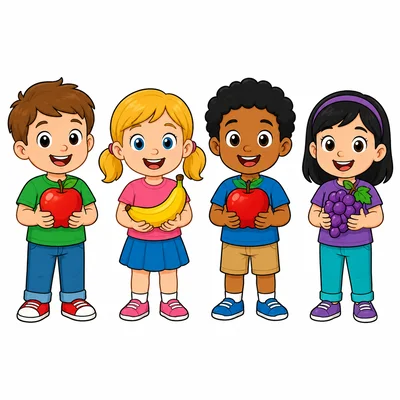
Four friends picked their favorite fruit. Ana picked apples. Ben picked bananas. Cam picked apples. Dee picked grapes. How many friends picked apples?
- 2
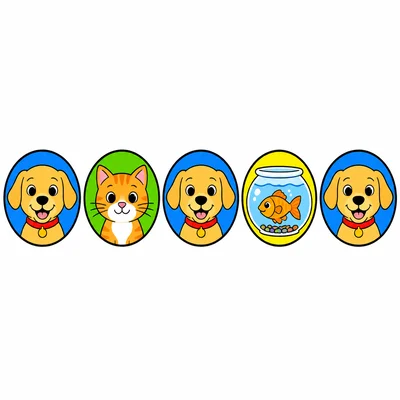
Look at the pet votes: dog, cat, dog, fish, dog. Which pet got the most votes?
- 3
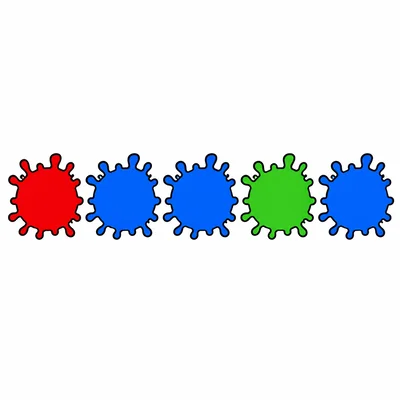
Mia asked, "What is your favorite color?" The answers were red, blue, blue, green, blue. How many votes did blue get?
- 4

Make tally marks for 4 votes for pizza.
- 5
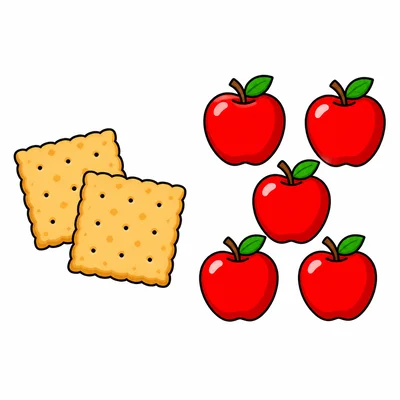
A class voted for a favorite snack. Crackers got 2 votes. Apples got 5 votes. Which snack got more votes?
- 6

Count the ice cream votes: chocolate, vanilla, vanilla, chocolate, strawberry, vanilla. How many children voted in all?
- 7
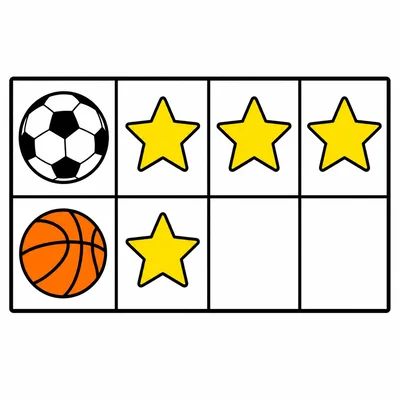
A picture graph shows 3 stars for soccer and 1 star for basketball. Which sport is the favorite?
- 8
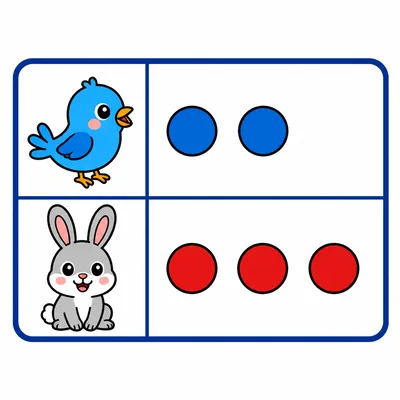
Draw a picture graph for these favorite animal votes: bird has 2 votes and rabbit has 3 votes.
- 9
Which question would help you collect data about favorite drinks? A. What is your name? B. What is your favorite drink?
- 10
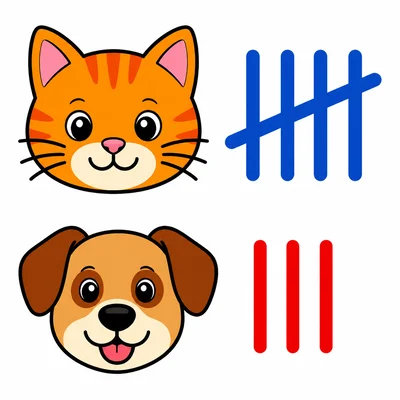
A tally chart shows 5 votes for cats and 3 votes for dogs. How many votes are there in all?
- 11
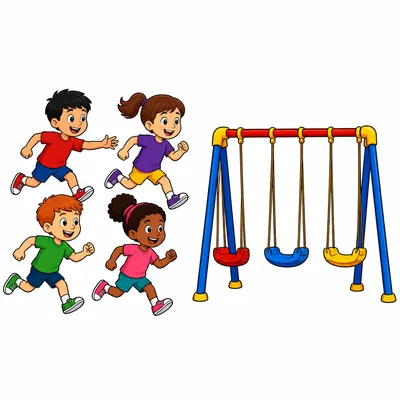
Sam counted favorite playground games. Tag got 4 votes. Swings got 4 votes. Which game got more votes?
- 12
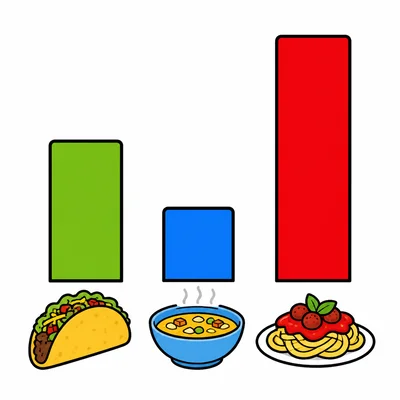
A bar graph shows favorite foods. Tacos has a bar up to 2. Soup has a bar up to 1. Pasta has a bar up to 4. Which food got the least votes?
- 13
Lina wants to know the favorite book in her class. What should she ask her classmates?
- 14
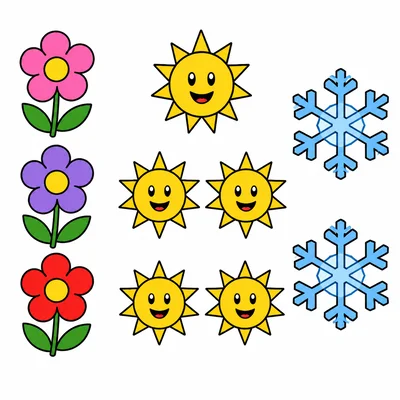
Use the data to finish the sentence. Favorite seasons: spring 3 votes, summer 5 votes, winter 2 votes. The season with the most votes is ____.
- 15
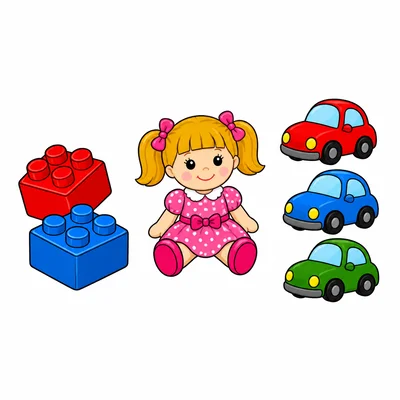
You asked 6 friends their favorite toy. Blocks got 2 votes. Dolls got 1 vote. Cars got 3 votes. Did you count all 6 friends?