Practice modeling positive and negative feedback loops in natural and human-made systems, using diagrams, explanations, and predictions.
Read each problem carefully. Identify system parts, feedback relationships, and likely outcomes. Show your reasoning in the space provided.
Identifying, diagramming, and predicting system behavior
Science - Grade 9-12
- 1
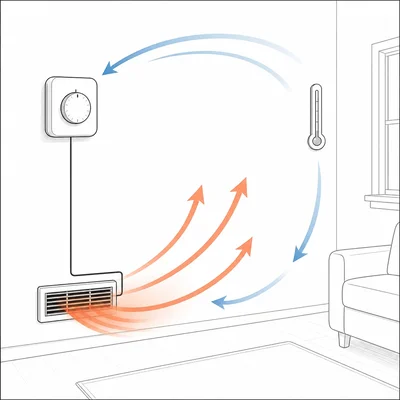
A thermostat is set to 20°C. When the room temperature falls below 20°C, the heater turns on. When the room reaches 20°C, the heater turns off. Identify the feedback loop type and explain how it affects the system.
- 2
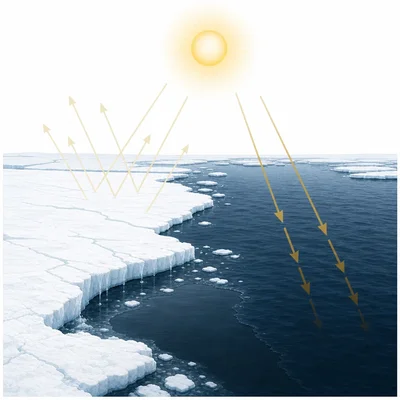
In a warming climate, Arctic sea ice melts. Dark ocean water absorbs more sunlight than bright ice, which causes more warming and more ice melt. Identify the feedback loop type and explain the cause-and-effect pattern.
- 3
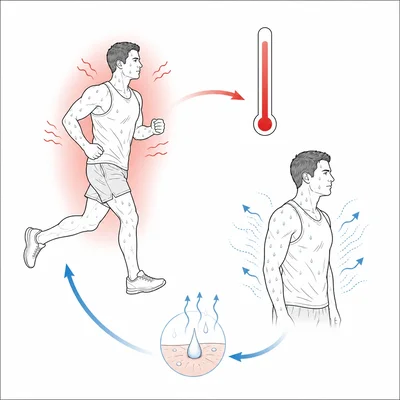
Complete this feedback model using plus or minus signs: More exercise leads to increased body temperature. Increased body temperature leads to more sweating. More sweating leads to lower body temperature. Is the overall loop positive or negative?
- 4
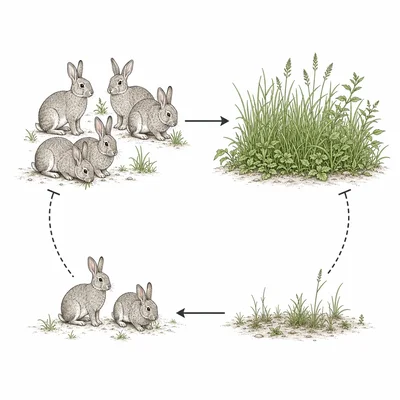
A population of rabbits grows when food is abundant. As the rabbit population increases, available food decreases. As food decreases, rabbit birth rates decrease. Explain why this is a negative feedback loop.
- 5
A student writes, 'All feedback loops are bad because they make systems unstable.' Correct this statement using examples of both positive and negative feedback.
- 6
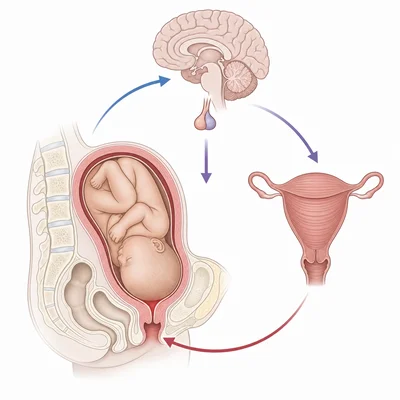
During childbirth, pressure from the baby on the cervix causes the release of oxytocin. Oxytocin strengthens contractions, which increases pressure on the cervix and releases more oxytocin. Identify the loop type and explain when the loop stops.
- 7
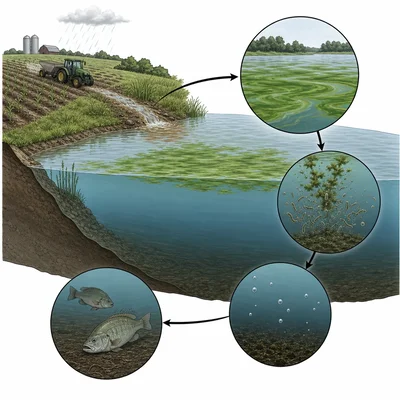
A lake receives fertilizer runoff from nearby farms. Extra nutrients increase algae growth. When algae die, decomposers use oxygen, which lowers oxygen levels for fish. Create a simple causal chain and describe one possible feedback effect if fish populations decline.
- 8
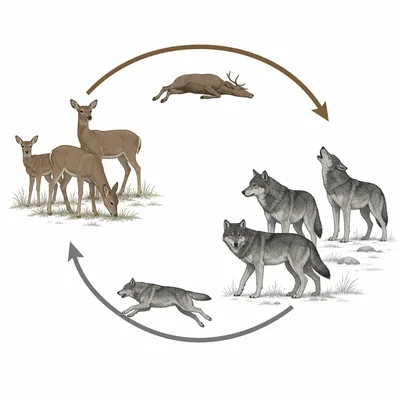
In a predator-prey system, an increase in deer provides more food for wolves. More wolves then hunt more deer, which can reduce the deer population. Explain how this feedback can help regulate the deer population.
- 9
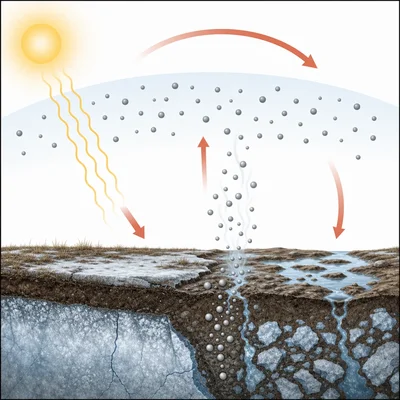
A model shows this loop: more atmospheric carbon dioxide leads to higher global temperature, higher temperature leads to thawing permafrost, and thawing permafrost releases more carbon dioxide and methane. Identify the feedback type and name one limitation of this simple model.
- 10
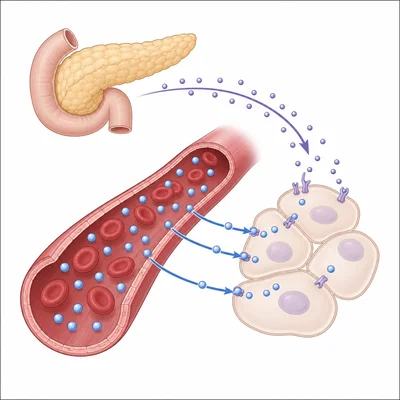
A person has high blood glucose after a meal. The pancreas releases insulin, which helps cells take in glucose and lowers blood glucose levels. Identify the feedback loop type and the regulated variable.
- 11
Compare a stock market panic with a thermostat. In a panic, falling prices can cause more investors to sell, which lowers prices further. Explain which system is more likely to show positive feedback and which shows negative feedback.
- 12
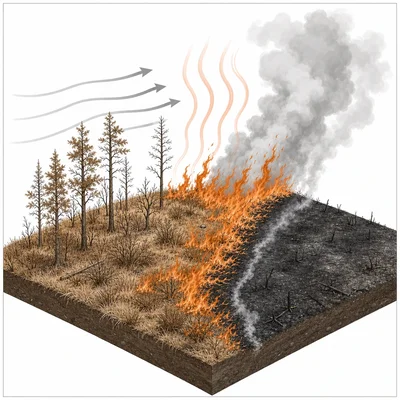
A scientist builds a computer model of a forest fire system. The model includes temperature, dry vegetation, wind speed, and burned area. Explain how positive feedback could occur in this model and name one factor that could limit the feedback.
- 13
Two students disagree about a feedback diagram. Student A says a negative arrow always means the feedback loop is negative. Student B says the whole loop must be considered. Which student is correct, and why?
- 14
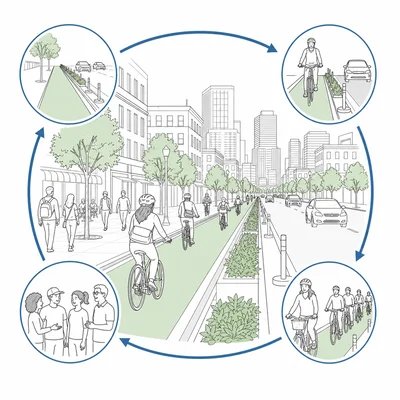
A city installs more bike lanes. More bike lanes make biking safer and easier. As more people bike, public support for bike infrastructure grows, leading to even more bike lanes. Identify the feedback loop type and explain one possible real-world limit.
- 15
Design a feedback loop model for one system of your choice, such as climate, ecosystems, the human body, economics, or technology. Name at least three variables, label the loop as positive or negative, and explain what the model predicts.