River Flood Hydrograph Lab
Change the storm and the watershed, then watch the flood hydrograph respond. See how rainfall intensity, slope, soil saturation, and urbanization control the peak discharge, the lag time, and the risk of overbank flooding. Overlay the developed watershed on its natural, pre-development response to see what paving the ground does.
Guided ExperimentHow does urbanization change a flood hydrograph?
If you increase the percentage of impervious (paved) surface, what happens to the peak discharge and the lag time?
Write your hypothesis in the Lab Report panel, then click Next.
Controls
Flood Hydrograph (discharge over time)
Results
Peak discharge
135.8m³/s
Time to peak
4.70h
Lag time
2.70h
Runoff coefficient
0.48
Total runoff volume
1.92 million m³
Flood risk
Moderate
What this shows
- Urbanizing the watershed to 20 percent impervious surface raised the peak discharge by about 20 percent and shortened the lag time compared with the natural watershed.
- Moist soil allowed moderate infiltration, giving a runoff coefficient between the dry and saturated cases.
- The peak discharge stayed below the channel capacity, so the river should contain this storm.
Peak discharge uses the Rational Method, Q = C i A, where C is the runoff coefficient, i is rainfall intensity, and A is watershed area.
Data Table
(0 rows)| # | Rainfall(mm/hr) | Urbanization(%) | Slope | Soil | Peak Q(m³/s) | Lag(h) |
|---|
Reference Guide
What a Hydrograph Shows
A hydrograph is a graph of river discharge against time during and after a storm. It has a clear shape that tells the story of the storm.
- Rising limb. Discharge climbs as runoff reaches the river.
- Peak discharge. The highest flow during the event.
- Lag time. The delay from peak rainfall to peak discharge.
- Recession limb. The slow fall back toward baseflow.
A tall, early, sharp peak is called a flashy hydrograph. A low, late, broad peak means the watershed responds slowly.
The Rational Method
Engineers estimate the peak discharge of a small watershed with the Rational Method, written as Q = C i A.
- Q. Peak discharge in cubic metres per second.
- C. Runoff coefficient, the fraction of rain that runs off.
- i. Rainfall intensity, converted to metres per second.
- A. Watershed area, converted to square metres.
Because Q is proportional to i, doubling the rainfall intensity roughly doubles the peak discharge for the same watershed.
Urbanization Makes Hydrographs Flashier
Roads, roofs, and car parks are impervious, so rain cannot soak in. Stormwater drains carry it straight to the river.
- Higher peak. More of the rain becomes runoff.
- Shorter lag. Water reaches the river much faster.
- Higher risk. A taller, earlier peak can exceed the channel capacity.
Comparing the developed and natural hydrographs shows why cities use detention ponds and permeable surfaces to slow runoff down.
Infiltration, Soil, and Slope
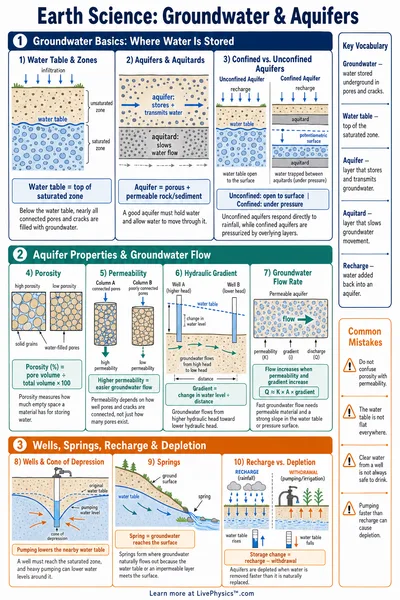
Infiltration is the rain that soaks into the ground instead of running off. It depends on how wet the soil already is and how steep the land is.
- Saturated soil. Little room left to absorb rain, so most runs off.
- Dry soil. Soaks up more rain, lowering the runoff coefficient.
- Steep slope. Water moves downhill fast, giving an earlier, sharper peak.
A second storm soon after the first often floods worse because the soil is already saturated and cannot absorb more water.