Practice interpreting scatterplots, writing and using linear regression equations, calculating residuals, and understanding the meaning of a line of best fit.
Read each problem carefully. Show your work in the space provided. Round decimal answers to the nearest tenth unless another direction is given.
Modeling relationships with scatterplots, slope, residuals, and predictions
Statistics - Grade 9-12
- 1
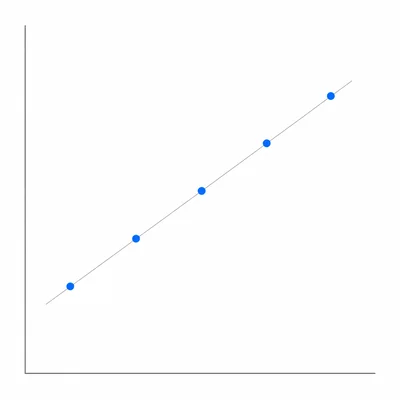
A student records the number of hours studied and the score earned on a test. The data are: (1, 68), (2, 72), (3, 78), (4, 83), (5, 87). Identify the explanatory variable, the response variable, and the general direction of the association.
- 2
A regression model for predicting a quiz score from hours of studying is y = 4.5x + 62, where x is hours studied and y is the predicted quiz score. Find the predicted quiz score for a student who studies for 6 hours.
- 3
A line of best fit for predicting monthly savings from monthly income is y = 0.18x + 45, where x is monthly income in dollars and y is monthly savings in dollars. Interpret the slope in context.
- 4
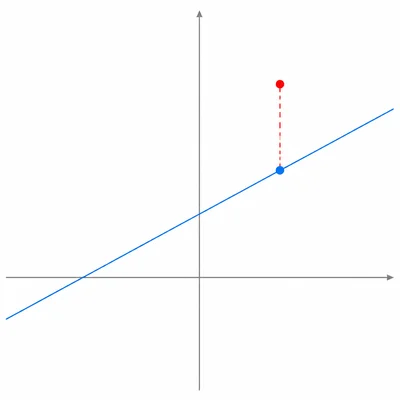
A regression equation is y = 2.3x + 15. A data point has x = 10 and an actual y-value of 41. Find the predicted value and the residual.
- 5
A regression equation for predicting plant height from days after planting is y = 1.7x + 4.2. Explain what the y-intercept means in context, and state whether it is reasonable.
- 6
Use the data points (1, 2), (2, 4), (3, 5), (4, 7), and (5, 8). The mean of x is 3 and the mean of y is 5.2. The sum of the products of deviations is 15, and the sum of squared x-deviations is 10. Find the least-squares regression line.
- 7

A data set includes x-values from 2 to 12. A regression model from this data is used to predict y when x = 9 and when x = 20. Classify each prediction as interpolation or extrapolation.
- 8
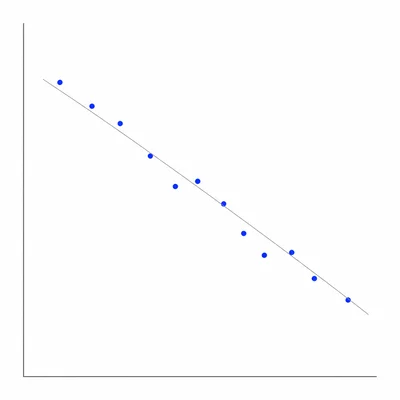
A scatterplot has correlation coefficient r = -0.86. Describe the direction and strength of the linear relationship.
- 9
For a regression model, the correlation coefficient is r = 0.75. Find r squared and explain its meaning in context.
- 10
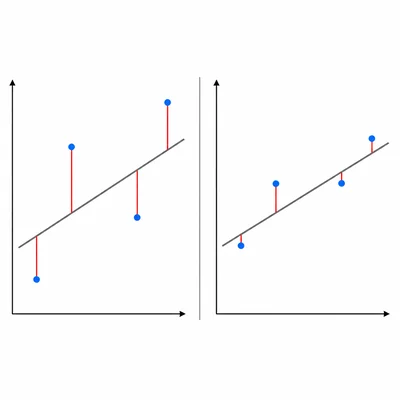
Two possible lines are used to model the same data. Line A has residuals 2, -1, 3, and -2. Line B has residuals 1, -1, 1, and -1. Compare the sums of squared residuals and identify which line fits better by the least-squares criterion.
- 11
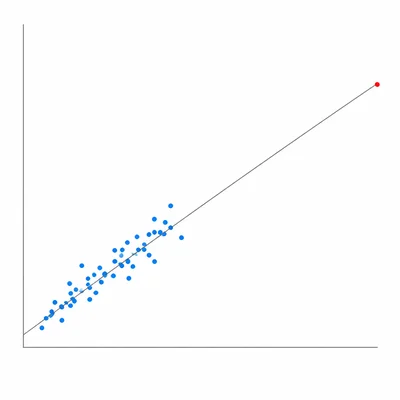
A scatterplot shows a strong positive linear trend, but one point is far from the rest of the data with a very large x-value. Explain how this point could affect the regression line.
- 12
A regression model shows that students who spend more time on a homework app tend to have higher course grades. Explain why this does not prove that the app causes higher grades.