Practice constructing, interpreting, and evaluating confidence intervals for means, proportions, differences, paired data, and regression slopes.
Read each problem carefully. Show formulas, substitutions, and reasoning. State conclusions in context.
Estimating population parameters with uncertainty
Statistics - Grade advanced
- 1
A random sample of 64 adults has a mean systolic blood pressure of 126.4 mmHg. Assume the population standard deviation is known to be 12.8 mmHg. Construct a 95% confidence interval for the population mean systolic blood pressure.
- 2
A sample of 25 batteries has a mean lifetime of 18.6 hours and a sample standard deviation of 2.5 hours. Assume battery lifetimes are approximately normally distributed. Construct a 99% confidence interval for the population mean lifetime.
- 3
A survey of 1,200 voters finds that 642 support a proposed policy. Construct a 90% confidence interval for the true proportion of voters who support the policy.
- 4
A researcher reports a 95% confidence interval for the mean difference in test scores after a tutoring program as (2.4, 7.8) points, where the difference is posttest minus pretest. Interpret this interval in context.
- 5

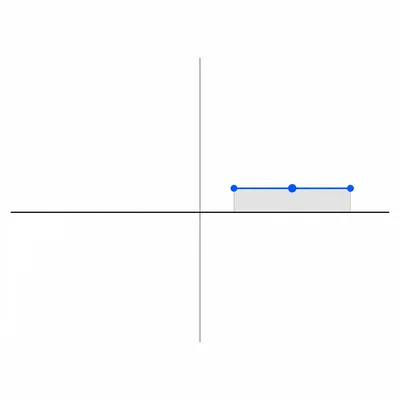
A 95% confidence interval for a population mean is (48.2, 55.6). Find the sample mean and the margin of error.
- 6

A 95% confidence interval for a population proportion is (0.38, 0.46). Decide whether a hypothesized population proportion of 0.50 is plausible based on this interval. Explain your reasoning.
- 7
A medical study compares recovery times for two treatments. Treatment A has n = 40, mean = 12.3 days, and standard deviation = 3.1 days. Treatment B has n = 45, mean = 14.1 days, and standard deviation = 3.6 days. Construct an approximate 95% confidence interval for mean recovery time for A minus B using a two-sample t procedure with approximate critical value t* = 2.01.
- 8

A class collected paired data on reaction time before and after drinking a caffeinated beverage. For 18 students, the mean paired difference, defined as before minus after, is 0.082 seconds, with a standard deviation of the differences of 0.110 seconds. Construct a 95% confidence interval for the true mean paired difference. Use t* = 2.110.
- 9
An environmental scientist wants the margin of error for a 95% confidence interval for the mean nitrate level in water to be at most 0.20 mg/L. Based on prior studies, the population standard deviation is estimated as 0.90 mg/L. What minimum sample size is needed?
- 10
A pollster wants to estimate a population proportion with 99% confidence and a margin of error no larger than 0.03. No prior estimate of the proportion is available. What minimum sample size should the pollster use?
- 11
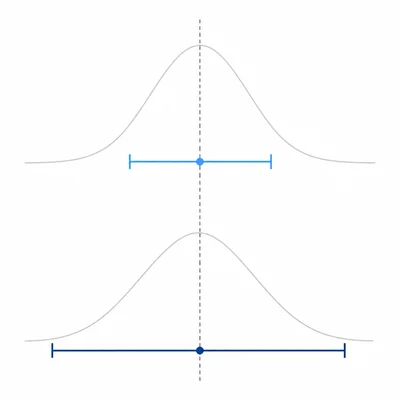
Explain why increasing the confidence level from 90% to 99%, while keeping the same sample data and method, makes a confidence interval wider.
- 12
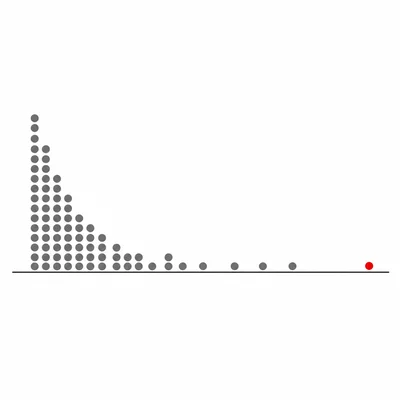
A sample of 10 observations is used to construct a t-confidence interval for a population mean. The data are strongly right-skewed with one extreme high outlier. Explain whether the t-interval is appropriate and what the researcher should consider.
- 13
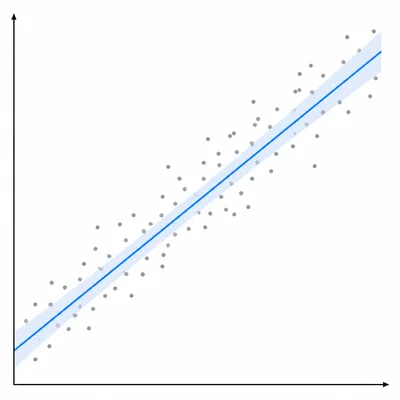
A regression analysis predicting final exam score from hours studied gives a slope estimate of 4.2 points per hour with standard error 1.1. Using t* = 2.06, construct a 95% confidence interval for the true slope and interpret it.
- 14
A study reports a 95% confidence interval for the difference in two population proportions, p1 minus p2, as (-0.07, 0.03). What conclusion should be drawn about whether the two population proportions differ?
- 15
A random sample of 36 machines has a mean energy use of 5.42 kWh per hour and a sample standard deviation of 0.84 kWh per hour. A 95% t-interval is constructed as (5.136, 5.704). Identify the parameter, statistic, and one correct interpretation of the confidence level.