Practice linear and multiple regression by interpreting coefficients, making predictions, analyzing residuals, and evaluating model assumptions.
Read each problem carefully. Show your work, define variables when needed, and explain your reasoning using statistical language.
Modeling relationships, interpreting coefficients, and checking assumptions
Statistics - Grade advanced
- 1
A study models exam score using hours studied. The fitted regression equation is score = 62.4 + 4.8(hours). Interpret the slope in context.
- 2
Using the model score = 62.4 + 4.8(hours), predict the exam score for a student who studied 6.5 hours.
- 3
A regression model predicting monthly electricity cost from outdoor temperature is cost = 158.2 - 1.35(temperature), where temperature is measured in degrees Fahrenheit. Interpret the intercept. Is it likely meaningful in this context?
- 4
A data set has correlation r = 0.82 between engine size and vehicle price. What is the coefficient of determination, and what does it mean in context?
- 5
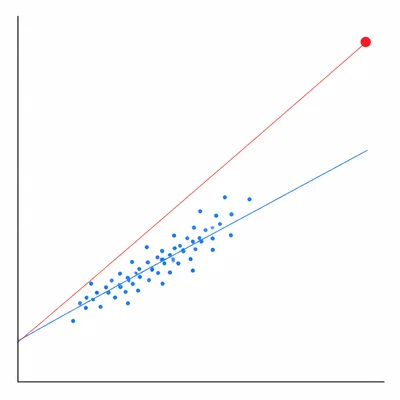
A scatterplot of house size and selling price shows a strong positive linear trend, but one point represents a 10,000 square foot mansion priced far above the others. Explain how this point could affect the regression line.
- 6
A residual is defined as observed value minus predicted value. A student observed a delivery time of 42 minutes, and the regression model predicted 37 minutes. Find and interpret the residual.
- 7
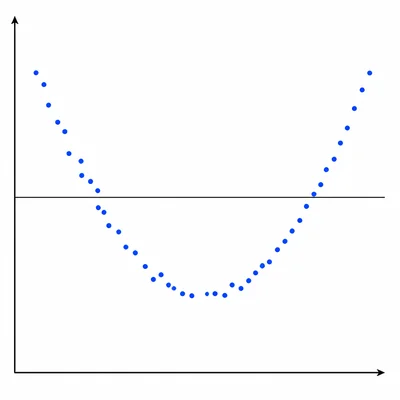
A residual plot shows residuals that form a clear U-shaped pattern. What does this suggest about the appropriateness of a linear regression model?
- 8
A researcher fits a regression model predicting systolic blood pressure from age and body mass index. The fitted model is blood pressure = 74.1 + 0.62(age) + 1.85(BMI). Interpret the coefficient of BMI.
- 9
For the model blood pressure = 74.1 + 0.62(age) + 1.85(BMI), predict the systolic blood pressure for a 50-year-old person with a BMI of 28.
- 10
A regression output gives a slope estimate of 2.40 with standard error 0.60 for predicting crop yield from fertilizer amount. Test the null hypothesis that the true slope is 0 by computing the t-statistic.
- 11
A 95% confidence interval for a regression slope is (-0.15, 1.92). Explain what this interval suggests about whether the predictor has a statistically significant linear relationship with the response at the 0.05 level.
- 12
A model predicting annual income from years of education has R squared = 0.38. Another model adds work experience and has R squared = 0.47, but adjusted R squared only increases from 0.36 to 0.37. Explain why adjusted R squared is useful here.
- 13
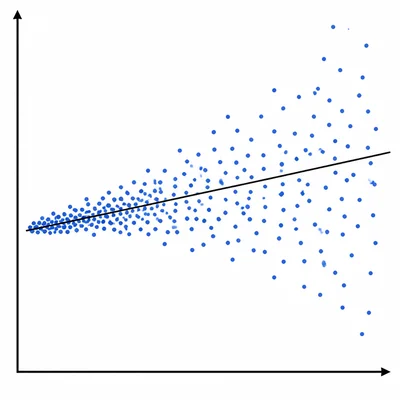
A scatterplot of advertising spending and sales shows increasing spread in sales as advertising spending increases. Which regression assumption may be violated, and what is the issue called?
- 14
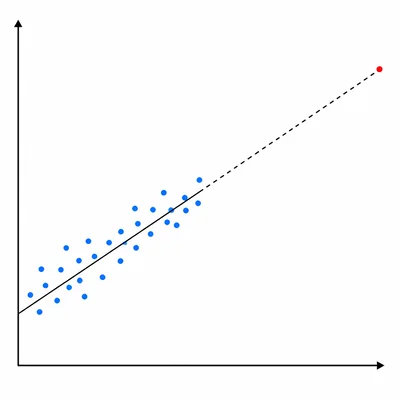
A company uses a regression model trained on data from stores with floor areas between 1,000 and 8,000 square feet. The model is used to predict sales for a new store with 25,000 square feet. Explain the statistical concern.
- 15
In a multiple regression model, two predictors have a correlation of 0.96. Explain the problem this may cause and how it can affect coefficient interpretation.
- 16
A regression output includes the following summary: residual standard error = 3.2 and response variable = plant height in centimeters. Interpret the residual standard error in context.