Practice setting up and interpreting hypothesis tests for means, proportions, variances, independence, and multiple groups.
Read each problem carefully. State the hypotheses, choose the correct test, show calculations, and write a conclusion in context.
Testing claims with p-values, critical values, and error analysis
Statistics - Grade advanced
- 1
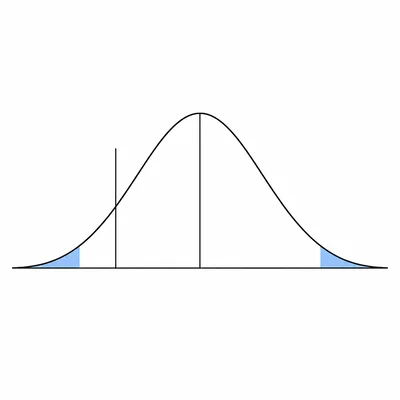
A company claims its light bulbs last an average of 1000 hours. A random sample of 40 bulbs has a mean lifetime of 965 hours and a sample standard deviation of 120 hours. Test the claim at the 0.05 significance level using a two-sided test.
- 2
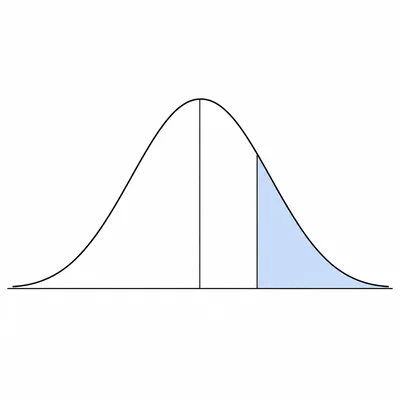
A political poll finds that 312 out of 600 randomly selected voters support a proposed policy. Test whether the true support proportion is greater than 0.50 at alpha = 0.05.
- 3
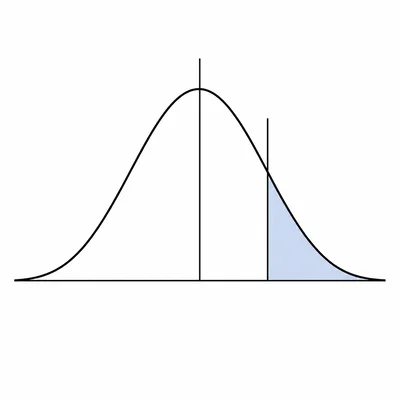
A new teaching method is compared with a standard method. Test scores from independent random samples are shown: new method n = 25, mean = 84, s = 10; standard method n = 30, mean = 78, s = 12. Test whether the new method has a higher mean score at alpha = 0.05. Assume unequal variances.
- 4

A drug trial records recovery times for 12 patients before and after a treatment change. The differences, computed as before minus after, have mean 3.4 days and standard deviation 4.8 days. Test whether the treatment change reduces recovery time at alpha = 0.05.
- 5
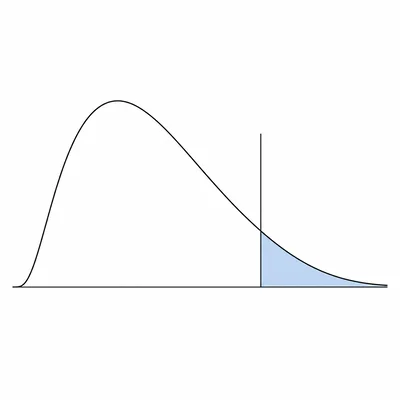
A manufacturer wants to know whether a machine's variance in fill volume has increased beyond 4.0 square milliliters. A sample of 20 containers has sample variance 6.2. Test at alpha = 0.05 assuming normal fill volumes.
- 6
The following contingency table summarizes whether customers bought a warranty by age group: under 30: 18 yes, 42 no; 30 to 49: 35 yes, 65 no; 50 and older: 47 yes, 53 no. Test whether warranty purchase is independent of age group at alpha = 0.05.
- 7
A one-way ANOVA compares mean reaction times across four caffeine dose groups. The between-groups sum of squares is 450 and the within-groups sum of squares is 1800. There are 10 participants in each group. Test for any difference among group means at alpha = 0.05.
- 8
For a two-sided z test of H0: mu = 50 versus Ha: mu is not equal to 50, the test statistic is z = -2.31. Find the p-value and state the conclusion at alpha = 0.01.
- 9

A researcher reports a 95% confidence interval for a mean difference of (1.2, 5.8). Explain what this interval implies for a two-sided hypothesis test of H0: mu_diff = 0 at alpha = 0.05.
- 10

A lab tests 20 independent null hypotheses, all at alpha = 0.05, without any correction. If all 20 null hypotheses are actually true, what is the probability of making at least one Type I error?
- 11
Define a Type I error and a Type II error in the context of a medical screening test where H0 means a patient does not have the disease and Ha means a patient has the disease.
- 12
A power analysis states that a test has power 0.80 to detect a specified effect size at alpha = 0.05. Interpret the meaning of power in this setting.
- 13
A random sample of 150 students has mean study time 14.2 hours per week with sample standard deviation 5.5 hours. Test H0: mu = 15 versus Ha: mu < 15 at alpha = 0.05.
- 14
A quality-control engineer wants to test whether the defect rate is below 3%. In a sample of 500 items, 9 are defective. Test H0: p = 0.03 versus Ha: p < 0.03 at alpha = 0.05.
- 15
A study reports p = 0.003 for a hypothesis test. Which statement is the best interpretation: A, the null hypothesis has a 0.3% chance of being true; B, assuming the null hypothesis is true, results at least as extreme as the observed result would occur about 0.3% of the time; C, the alternative hypothesis has a 99.7% chance of being true. Explain your choice.