Sign in to save

Bookmark this page so you can find it later.

Sign in to save

Bookmark this page so you can find it later.

P-Hacking & Multiple Comparisons Lab

Test one hypothesis at the five percent level and a false positive is rare. Test a hundred at once and several false positives are almost guaranteed. Generate a batch of tests, see the false discoveries appear, and watch each correction method tame them.

Guided Experiment: How many false positives appear when you test 100 nulls, and how does each correction change that?

Predict how many of 100 pure null tests will come out significant at alpha 0.05 with no correction, then predict what Bonferroni and Benjamini-Hochberg will do to that count.

Write your hypothesis in the Lab Report panel, then click Next.

Controls

tests
real

Each new study draws a fresh batch of p-values from the same setup, so the false positives land on different tests every time, just like rerunning a real experiment from scratch.

Test grid

One cell per test, colored by its outcome under the current correction. Switch the method to watch the false positives appear and vanish.

Test 1: p = 0.0001, real effectTest 2: p = 0.0000, real effectTest 3: p = 0.0032, real effectTest 4: p = 0.0048, real effectTest 5: p = 0.0000, real effectTest 6: p = 0.0804, real effectTest 7: p = 0.1721, real effectTest 8: p = 0.0001, real effectTest 9: p = 0.0000, real effectTest 10: p = 0.0017, real effectTest 11: p = 0.2859, nullTest 12: p = 0.1909, nullTest 13: p = 0.0427, nullTest 14: p = 0.4274, nullTest 15: p = 0.5904, nullTest 16: p = 0.7987, nullTest 17: p = 0.2949, nullTest 18: p = 0.2055, nullTest 19: p = 0.6581, nullTest 20: p = 0.5461, nullTest 21: p = 0.7584, nullTest 22: p = 0.1928, nullTest 23: p = 0.7209, nullTest 24: p = 0.4541, nullTest 25: p = 0.7704, nullTest 26: p = 0.9945, nullTest 27: p = 0.2393, nullTest 28: p = 0.7570, nullTest 29: p = 0.1533, nullTest 30: p = 0.3233, nullTest 31: p = 0.4132, nullTest 32: p = 0.2492, nullTest 33: p = 0.1521, nullTest 34: p = 0.7261, nullTest 35: p = 0.5763, nullTest 36: p = 0.1272, nullTest 37: p = 0.2647, nullTest 38: p = 0.0487, nullTest 39: p = 0.6222, nullTest 40: p = 0.8658, nullTest 41: p = 0.2385, nullTest 42: p = 0.9894, nullTest 43: p = 0.7183, nullTest 44: p = 0.4023, nullTest 45: p = 0.3024, nullTest 46: p = 0.6772, nullTest 47: p = 0.9526, nullTest 48: p = 0.9233, nullTest 49: p = 0.6927, nullTest 50: p = 0.9189, nullTest 51: p = 0.8344, nullTest 52: p = 0.9338, nullTest 53: p = 0.1148, nullTest 54: p = 0.0394, nullTest 55: p = 0.8687, nullTest 56: p = 0.2945, nullTest 57: p = 0.8812, nullTest 58: p = 0.5101, nullTest 59: p = 0.9359, nullTest 60: p = 0.7044, nullTest 61: p = 0.1663, nullTest 62: p = 0.6768, nullTest 63: p = 0.9489, nullTest 64: p = 0.1319, nullTest 65: p = 0.9779, nullTest 66: p = 0.1630, nullTest 67: p = 0.3884, nullTest 68: p = 0.1176, nullTest 69: p = 0.4012, nullTest 70: p = 0.3243, nullTest 71: p = 0.6576, nullTest 72: p = 0.5091, nullTest 73: p = 0.5315, nullTest 74: p = 0.0761, nullTest 75: p = 0.8080, nullTest 76: p = 0.8542, nullTest 77: p = 0.2728, nullTest 78: p = 0.1643, nullTest 79: p = 0.3033, nullTest 80: p = 0.8940, nullTest 81: p = 0.2899, nullTest 82: p = 0.1437, nullTest 83: p = 0.6546, nullTest 84: p = 0.5491, nullTest 85: p = 0.3246, nullTest 86: p = 0.1202, nullTest 87: p = 0.1413, nullTest 88: p = 0.0674, nullTest 89: p = 0.3008, nullTest 90: p = 0.6756, nullTest 91: p = 0.6514, nullTest 92: p = 0.1168, nullTest 93: p = 0.5082, nullTest 94: p = 0.5232, nullTest 95: p = 0.2118, nullTest 96: p = 0.7922, nullTest 97: p = 0.2523, nullTest 98: p = 0.9917, nullTest 99: p = 0.9540, nullTest 100: p = 0.8700, null
True positive (real effect found)
False positive (null flagged)
Missed real effect
True negative (correctly not flagged)

Results under No correction

Discoveries (rejected)

11

out of 100 tests

True positives

8

real effects found

False positives

3

nulls flagged by chance

Missed real effects

2

false negatives

False discovery proportion

27.3%

false among discoveries

Power

80%

of real effects found

Why a correction is needed

With 100 tests and no correction, the chance of at least one false positive among the 90 null tests is about 99%. That is 1 minus (1 minus 0.05) to the power 100. The more tests you run, the closer this climbs to certainty.

This study ran 100 independent tests, 10 of which had a real effect. Under No correction you made 11 discoveries: 8 real and 3 false.

Sorted p-values and thresholds

Each dot is a test, sorted smallest p-value first. Filled dots are rejected under the current method. Compare the three thresholds directly.

0.0000.0350.070rank of test (1 to 100)p-valueuncorrected alpha = 0.05Bonferroni = 0.00050BH line = (i / m) × alpharank 1: p = 0.0000 (rejected)rank 2: p = 0.0000 (rejected)rank 3: p = 0.0000 (rejected)rank 4: p = 0.0001 (rejected)rank 5: p = 0.0001 (rejected)rank 6: p = 0.0017 (rejected)rank 7: p = 0.0032 (rejected)rank 8: p = 0.0048 (rejected)rank 9: p = 0.0394 (rejected)rank 10: p = 0.0427 (rejected)rank 11: p = 0.0487 (rejected)rank 12: p = 0.0674rank 13: p = 0.0761rank 14: p = 0.0804rank 15: p = 0.1148rank 16: p = 0.1168rank 17: p = 0.1176rank 18: p = 0.1202rank 19: p = 0.1272rank 20: p = 0.1319rank 21: p = 0.1413rank 22: p = 0.1437rank 23: p = 0.1521rank 24: p = 0.1533rank 25: p = 0.1630rank 26: p = 0.1643rank 27: p = 0.1663rank 28: p = 0.1721rank 29: p = 0.1909rank 30: p = 0.1928rank 31: p = 0.2055rank 32: p = 0.2118rank 33: p = 0.2385rank 34: p = 0.2393rank 35: p = 0.2492rank 36: p = 0.2523rank 37: p = 0.2647rank 38: p = 0.2728rank 39: p = 0.2859rank 40: p = 0.2899rank 41: p = 0.2945rank 42: p = 0.2949rank 43: p = 0.3008rank 44: p = 0.3024rank 45: p = 0.3033rank 46: p = 0.3233rank 47: p = 0.3243rank 48: p = 0.3246rank 49: p = 0.3884rank 50: p = 0.4012rank 51: p = 0.4023rank 52: p = 0.4132rank 53: p = 0.4274rank 54: p = 0.4541rank 55: p = 0.5082rank 56: p = 0.5091rank 57: p = 0.5101rank 58: p = 0.5232rank 59: p = 0.5315rank 60: p = 0.5461rank 61: p = 0.5491rank 62: p = 0.5763rank 63: p = 0.5904rank 64: p = 0.6222rank 65: p = 0.6514rank 66: p = 0.6546rank 67: p = 0.6576rank 68: p = 0.6581rank 69: p = 0.6756rank 70: p = 0.6768rank 71: p = 0.6772rank 72: p = 0.6927rank 73: p = 0.7044rank 74: p = 0.7183rank 75: p = 0.7209rank 76: p = 0.7261rank 77: p = 0.7570rank 78: p = 0.7584rank 79: p = 0.7704rank 80: p = 0.7922rank 81: p = 0.7987rank 82: p = 0.8080rank 83: p = 0.8344rank 84: p = 0.8542rank 85: p = 0.8658rank 86: p = 0.8687rank 87: p = 0.8700rank 88: p = 0.8812rank 89: p = 0.8940rank 90: p = 0.9189rank 91: p = 0.9233rank 92: p = 0.9338rank 93: p = 0.9359rank 94: p = 0.9489rank 95: p = 0.9526rank 96: p = 0.9540rank 97: p = 0.9779rank 98: p = 0.9894rank 99: p = 0.9917rank 100: p = 0.9945
Gray dashed. Uncorrected alpha line.Red dotted. Bonferroni alpha / m line.Teal. BH staircase, points below its active cutoff.

Data Table

(0 rows)
#Tests (m)Real effectsEffect strengthAlphaCorrectionDiscoveriesFalse positivesFDR (%)Power (%)
0 / 500
0 / 500
0 / 500

Reference Guide

The Multiple-Comparisons Problem

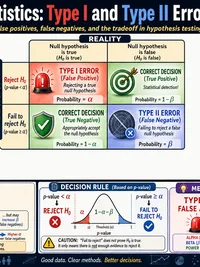
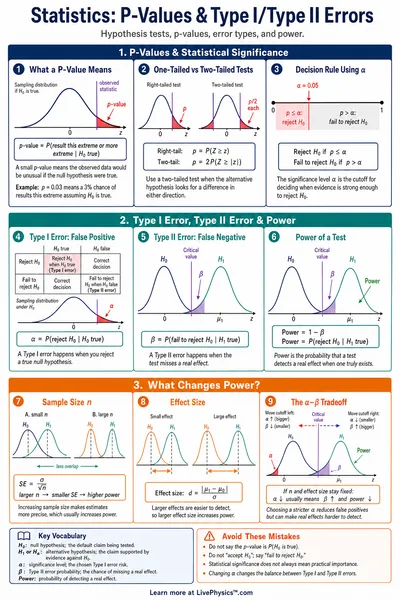
A single hypothesis test at alpha 0.05 has a five percent chance of a false positive when the null is true. Run many tests and those small chances add up fast.

  • Each null test flagged as significant is a false positive.
  • With 100 nulls at alpha 0.05 you expect about 5 false positives.
  • Reporting only the significant ones makes noise look like signal.

The fix is not to test fewer ideas. It is to adjust the threshold for how many tests you ran.

The Family-Wise Error Rate

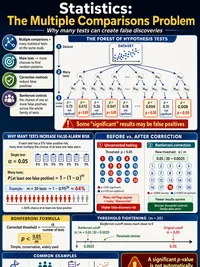
The family-wise error rate is the chance of at least one false positive across the whole set of tests. For m independent nulls with no correction it grows quickly.

FWER = 1 − (1 − alpha) to the power m

At alpha 0.05, m = 20 gives about 64 percent.

At m = 100 it is above 99 percent.

Raise the number of tests in the lab and watch the amber banner climb toward certainty.

Bonferroni and the FWER

The Bonferroni correction divides alpha by the number of tests. A test only counts as significant if its p-value clears that stricter bar.

Reject if p < alpha / m

This caps the chance of any false positive at alpha.

Bonferroni controls the family-wise error rate but is conservative. It can miss real effects, which lowers statistical power.

Benjamini-Hochberg and the FDR

The false discovery rate is the expected fraction of your discoveries that are false. Benjamini-Hochberg controls it instead of the FWER.

  • Sort the p-values from smallest to largest.
  • Find the largest rank k with p(k) ≤ (k / m) × alpha.
  • Reject the k smallest p-values.

BH keeps far more power than Bonferroni while still limiting false discoveries, which makes it the standard in fields that run thousands of tests.

P-Hacking and the Replication Crisis

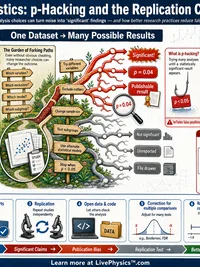
P-hacking means running many analyses and reporting only the ones that cross alpha, without telling anyone how many comparisons were tried. The published result looks impressive, but it is often a false positive dressed up as a finding.

  • Selective reporting. Hiding the tests that came out null.
  • Flexible analysis. Trying many outcomes until one is significant.
  • No correction. Treating each test as if it were the only one.

These practices inflate false positives, which is a major reason so many published results fail to replicate. Pre-registering hypotheses and applying a correction for the number of tests are the standard defenses.
Related Content