Practice setting up, calculating, and interpreting one-way ANOVA tests for comparing the means of multiple groups.
Read each problem carefully. Show your work in the space provided and write conclusions in context.
Using one-way ANOVA to compare three or more means
Statistics - Grade 9-12
- 1
A teacher compares average quiz scores for students who used flashcards, practice tests, or group study. Identify the explanatory variable, the response variable, and the number of groups.
- 2
Write the null and alternative hypotheses for a one-way ANOVA comparing mean battery life for four phone brands.
- 3
Explain why ANOVA is usually preferred over doing many separate two-sample t-tests when comparing four group means.
- 4
A one-way ANOVA compares 5 treatment groups with a total of 40 observations. Find the degrees of freedom between groups, within groups, and total.
- 5
In an ANOVA table, the mean square between groups is 120 and the mean square within groups is 30. Calculate the F statistic.
- 6
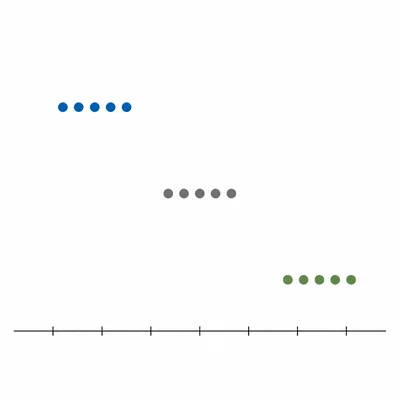
The dot plots show three groups. Group A, Group B, and Group C have clearly different centers, but each group has little spread. Describe whether the ANOVA F statistic would likely be small or large, and explain why.
- 7
A one-way ANOVA gives p = 0.018 when testing three exercise plans at alpha = 0.05. State the decision and conclusion in context.
- 8
A one-way ANOVA gives p = 0.22 when comparing mean plant heights under four fertilizers at alpha = 0.05. State the decision and conclusion in context.
- 9
List three main assumptions or conditions for using a one-way ANOVA.
- 10
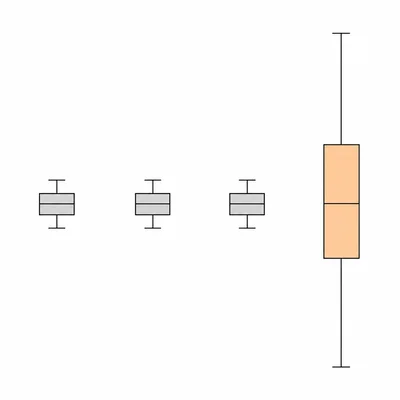
The boxplots for four classes show similar centers, but Class 4 has a much larger spread than the other classes. Which ANOVA condition might be a concern?
- 11
A one-way ANOVA has 3 groups and 18 total observations. The sum of squares between groups is 48 and the sum of squares within groups is 72. Find df between, df within, MS between, MS within, and F.
- 12
An ANOVA test finds a significant difference among five group means. Does this result identify exactly which group means are different from each other? Explain.
- 13
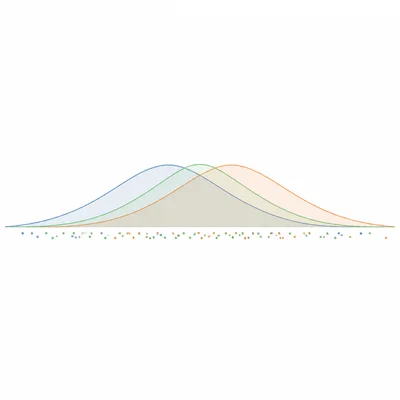
A researcher compares average sleep hours for students in three grade levels: 9th, 10th, and 11th grade. The graph shows the three sample means are close together. Predict whether the F statistic is likely to be large or small if the spreads are also large.
- 14
Decide whether each situation calls for a one-way ANOVA: comparing mean test scores for students taught by three different teaching methods, or comparing mean test scores by teaching method and gender at the same time.
- 15
In an ANOVA study, the sum of squares between groups is 40 and the total sum of squares is 100. Calculate eta squared and interpret it.