Power & Sample Size Planner
Statistical power is the chance a study detects a real effect. Choose an effect size as Cohen's d, a sample size, and a significance level, then read off the power, the Type II error, and the sample size required to reach your target. Two visualizations show the null versus alternative distributions and how power climbs as the sample grows.
Controls
Presets
Study design
Test direction
Results
Statistical power (1 − β)
49.1%
0.491
Type II error (β)
50.9%
miss a real effect
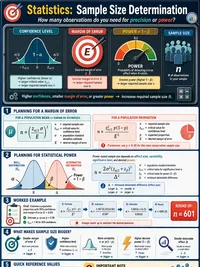
Required n for 80% power
63
per group
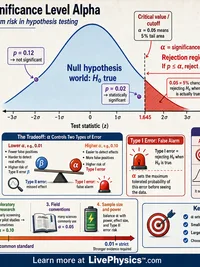
Critical z value
±1.960
rejection threshold
Noncentrality
1.936
effect in SE units
Effect size
0.50
Medium (Cohen)
Power rises with a bigger effect size, a larger sample, or a higher alpha. A stricter alpha or a smaller effect lowers it. Calculations use the normal (z) approximation standard for sample-size planning.
Null vs alternative distributions
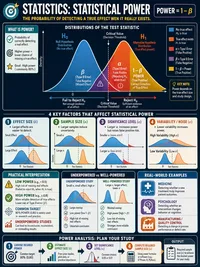
The slate curve is the null (no effect), the teal curve is the alternative (true effect, shifted right by the noncentrality). Power is the teal area of the alternative beyond the critical line.
Power vs sample size
Power as the sample size grows, for the current effect size and alpha. The indigo line marks your target power, and the markers show your current n and the n required to hit the target.
Reference Guide
Power and its four levers
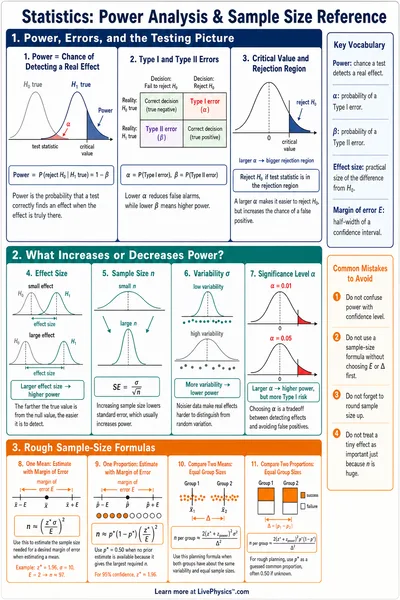
Statistical power is the probability of rejecting the null hypothesis when the alternative is true, written 1 − β. A study with low power is likely to miss a real effect.
- Effect size. Larger true effects are easier to detect, so power rises with Cohen's d.
- Sample size. More data tightens the sampling distribution and raises power.
- Significance level. A looser alpha makes rejection easier and raises power, at the cost of more false positives.
- Target power. Most studies aim for 80% or 90% power, which fixes the sample size you need.
Type I vs Type II error
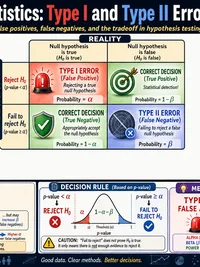
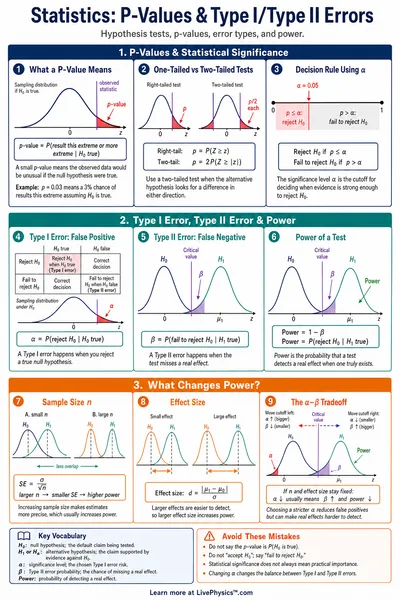
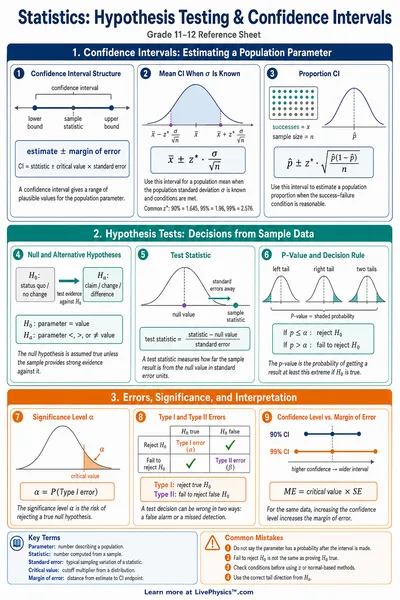
A Type I error (alpha) is a false alarm. You reject the null when no effect exists. A Type II error (beta) is a miss. You fail to reject the null when an effect does exist.
Power is exactly 1 − β. There is a trade-off. Shrinking alpha to avoid false positives pushes the critical value out, which lowers power and raises beta unless you add sample size.
Cohen's d benchmarks
Cohen's d is the difference between means measured in standard deviations. Common reference points help interpret a planned effect.
- Small. d ≈ 0.2, subtle and usually needs a large sample.
- Medium. d ≈ 0.5, a moderate effect visible to the eye.
- Large. d ≈ 0.8, a strong effect detectable with modest samples.
The two distributions
The distribution plot shows two bell curves on a shared z-axis. The null sits at zero. The alternative sits at the noncentrality, which equals d times the square root of the design-adjusted sample size.
The shaded alpha region is the tail of the null beyond the critical line. The shaded power region is the area of the alternative beyond that same line. As effect or sample grows, the alternative slides right and the power area expands.
Planning before a study
Power analysis belongs at the design stage, not after the data are in. Pick the smallest effect worth detecting, set your target power and alpha, and solve for the sample size.
The closed-form sample size uses the standard z formula. A one-sample design needs the base n. A two-sample design with equal groups needs roughly twice that per group, because each group contributes its own sampling error.
One-tailed vs two-tailed
A two-tailed test splits alpha across both directions, so its critical value is larger. For a directional hypothesis a one-tailed test puts all of alpha on one side, lowering the critical value and raising power for an effect in the expected direction.
Use a one-tailed test only when the direction is decided in advance. The tool reports power for both so you can compare the cost of the safer two-tailed choice.