Practice collecting, sorting, counting, and reading data in simple charts and graphs.
Read each problem carefully. Show your work in the space provided.
Using tally charts, tables, pictographs, and bar graphs
Math - Grade 2-3
- 1
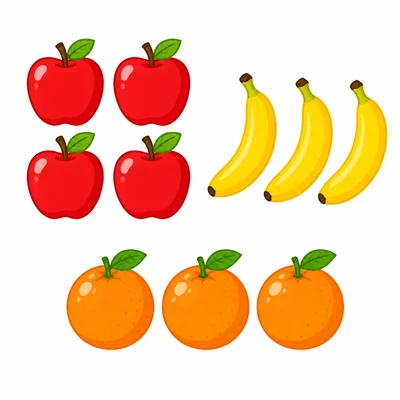
Ten students named their favorite fruit: apple, banana, apple, orange, banana, apple, orange, apple, banana, orange. Make a count for each fruit. Which fruit got the most votes?
- 2
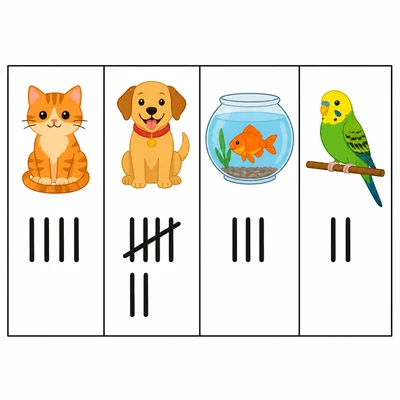
A class made this tally chart for favorite pets: cats = 4, dogs = 7, fish = 3, birds = 2. How many students answered the survey in all?
- 3

A pictograph shows favorite recess activities. Each star stands for 2 students. Soccer has 4 stars, basketball has 3 stars, and jump rope has 5 stars. How many students chose jump rope?
- 4
Write a survey question you could ask your class if you wanted to collect data about favorite school lunches.
- 5

A bar graph shows favorite colors. Red has 8 votes, blue has 5 votes, and green has 6 votes. How many more votes did red get than blue?
- 6

These numbers show how many books students read last month: 2, 4, 1, 3, 2, 5, 4, 2. Which number of books appears most often?
- 7
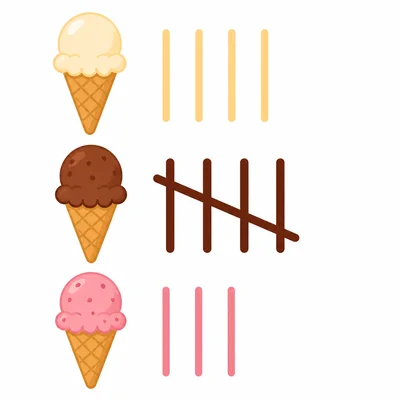
Twelve students voted for ice cream flavors. Vanilla got 4 votes, chocolate got 5 votes, and strawberry got 3 votes. Write the tally marks for chocolate.
- 8
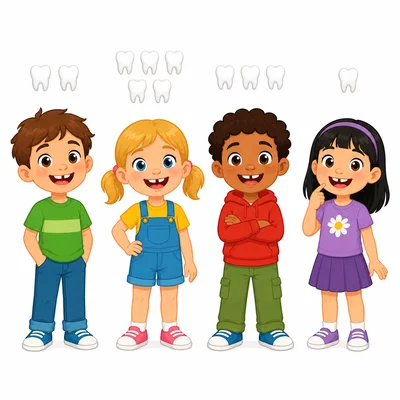
A table shows the number of lost teeth: Mia lost 2, Jayden lost 5, Sofia lost 3, and Leo lost 1. Who lost the fewest teeth?
- 9
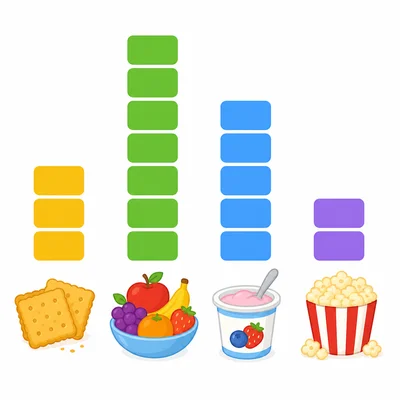
You asked classmates to name their favorite snack. The choices were crackers, fruit, yogurt, and popcorn. What kind of graph would be a good way to show these category data?
- 10
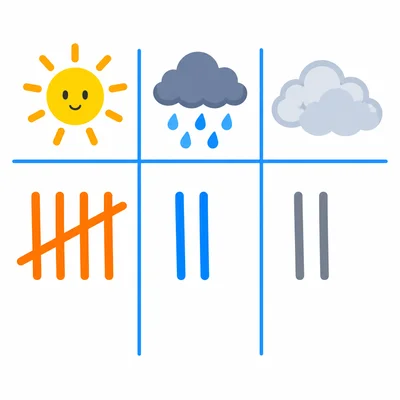
Make a tally chart for this weather data: sunny, rainy, sunny, cloudy, sunny, rainy, sunny, cloudy, sunny. How many sunny days were there?
- 11
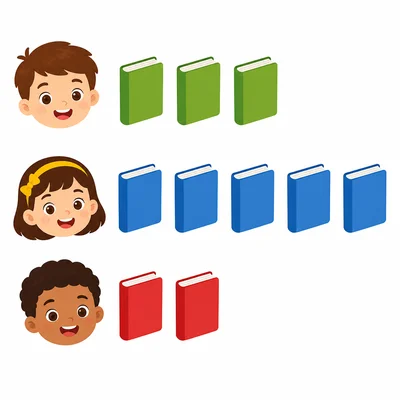
A pictograph shows books read this week. Each book picture stands for 1 book. Ana has 3 book pictures, Ben has 5 book pictures, and Cam has 2 book pictures. How many books did they read in all?
- 12
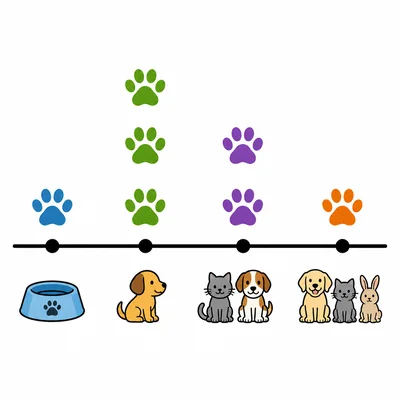
A line plot shows the number of pets students have. There is 1 X above 0 pets, 3 Xs above 1 pet, 2 Xs above 2 pets, and 1 X above 3 pets. How many students have 1 or 2 pets?
- 13
A class recorded how students get to school. Bus = 6, walk = 4, bike = 2, and car = unknown. If 15 students answered in all, how many students came by car?
- 14

Put these steps in the correct order for collecting and organizing data: count the answers, ask a survey question, make a chart or graph, record the answers.
- 15

A class collected data about favorite playground games: tag = 9, swings = 6, slide = 4, and jump rope = 5. Write a good title and labels for a bar graph of these data.