Practice reading data tables, finding totals, comparing amounts, and answering questions using table information.
Read each data table carefully. Use the information in the table to answer each question. Show your work in the space provided.
Use tables to find, compare, and explain information
Math - Grade 2-3
- 1
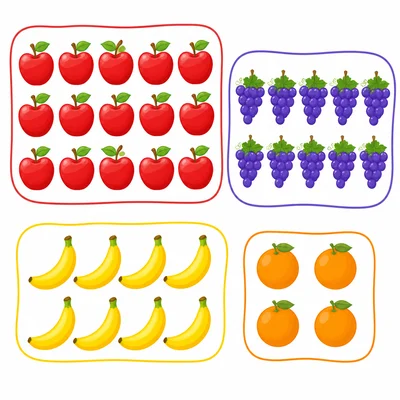
Data table: Favorite Fruit Apples: 12 students Bananas: 8 students Grapes: 10 students Oranges: 5 students Which fruit did the most students choose?
- 2
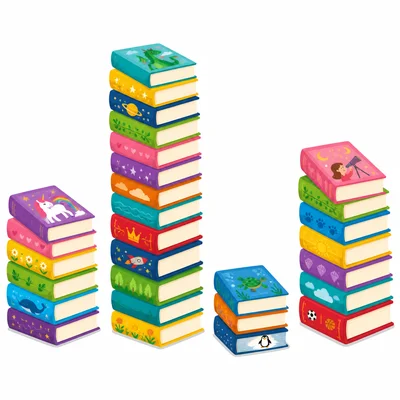
Data table: Books Read This Week Mia: 4 books Leo: 6 books Ava: 3 books Noah: 5 books How many books did Mia and Noah read altogether?
- 3
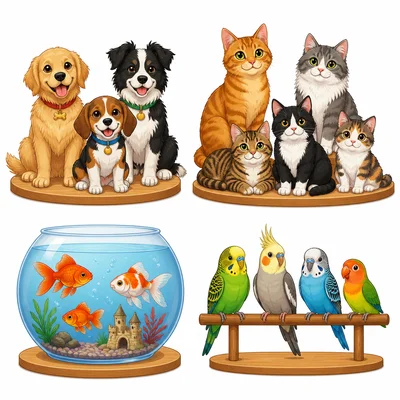
Data table: Pets in Room 12 Dogs: 7 Cats: 9 Fish: 4 Birds: 2 How many more cats are there than birds?
- 4
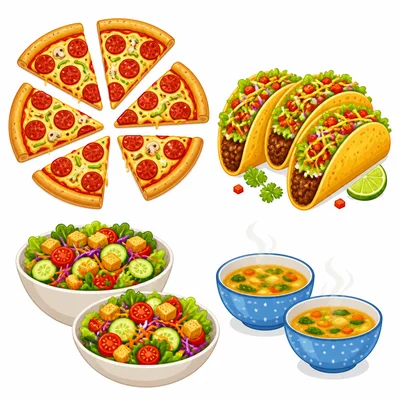
Data table: Lunch Choices Pizza: 15 students Tacos: 11 students Salad: 6 students Soup: 8 students Which lunch choice had exactly 8 students?
- 5
Data table: Weather in April Sunny days: 13 Rainy days: 9 Cloudy days: 6 Windy days: 2 How many days are shown in the table altogether?
- 6
Data table: Stickers Collected Red: 14 Blue: 12 Green: 9 Yellow: 14 Which two sticker colors have the same number?
- 7
Data table: Playground Activities Swings: 10 students Slide: 7 students Monkey bars: 5 students Soccer: 12 students Put the activities in order from fewest students to most students.
- 8
Data table: Pencils in Boxes Box A: 18 pencils Box B: 10 pencils Box C: 15 pencils Box D: 8 pencils Which box has fewer than 12 pencils?
- 9
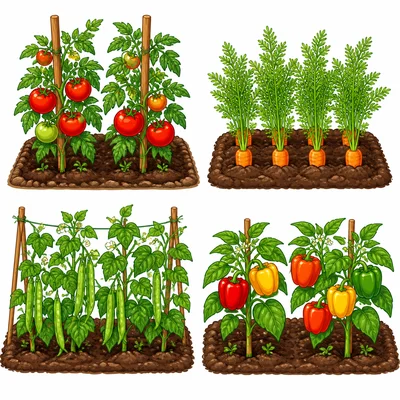
Data table: Class Garden Plants Tomatoes: 6 plants Carrots: 9 plants Beans: 7 plants Peppers: 4 plants How many carrot and bean plants are there in all?
- 10
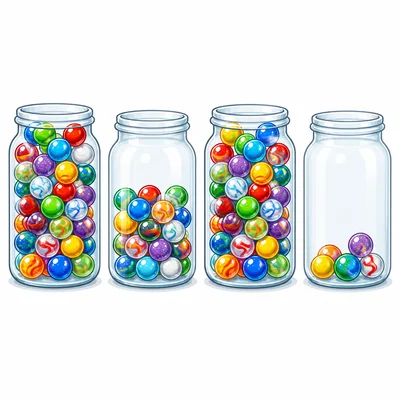
Data table: Marbles in Jars Jar 1: 20 marbles Jar 2: 16 marbles Jar 3: 20 marbles Jar 4: 12 marbles Which jars have the same number of marbles?
- 11
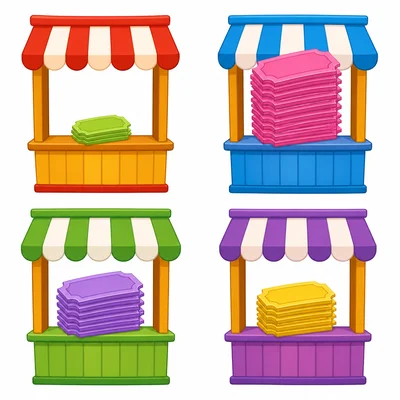
Data table: Tickets Sold Monday: 9 tickets Tuesday: 13 tickets Wednesday: 11 tickets Thursday: 7 tickets On which day were the fewest tickets sold?
- 12
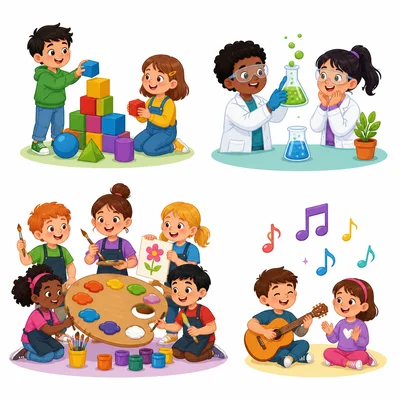
Data table: Favorite School Subjects Math: 8 students Science: 10 students Art: 12 students Music: 6 students How many students chose art or music?
- 13
Data table: Cans Recycled Team Red: 25 cans Team Blue: 18 cans Team Green: 21 cans Team Yellow: 16 cans How many more cans did Team Red recycle than Team Blue?
- 14
Data table: Animal Sightings on a Walk Squirrels: 8 Robins: 5 Butterflies: 11 Rabbits: 3 Which animal was seen more than 10 times?
- 15
Data table: Minutes of Reading Sam: 15 minutes Jada: 20 minutes Omar: 10 minutes Lily: 25 minutes What is the total number of minutes that Sam and Omar read?