Practice creating, reading, and comparing stem-and-leaf plots and box plots using real-world data sets.
Read each problem carefully. Show your work in the space provided. For stem-and-leaf plots, include a key when you create one.
Displaying and comparing data distributions
Math - Grade 6-8
- 1
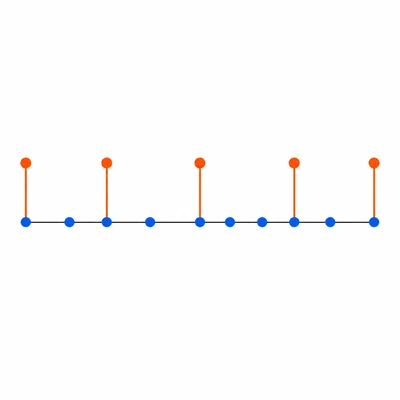
Create a stem-and-leaf plot for these quiz scores: 72, 85, 91, 76, 88, 84, 90, 73, 79, 86. Use the tens digit as the stem.
- 2
Use this stem-and-leaf plot: Stem 4: leaves 1, 5, 8; Stem 5: leaves 0, 2, 2, 9; Stem 6: leaves 3, 7. Key: 4 | 1 = 41. How many data values are in the plot?
- 3
Use this stem-and-leaf plot: Stem 2: leaves 4, 6, 9; Stem 3: leaves 1, 5, 8; Stem 4: leaves 0, 2. Key: 2 | 4 = 24. What is the median of the data?
- 4
A data set is shown in a stem-and-leaf plot: Stem 1: leaves 2, 5, 7; Stem 2: leaves 0, 4, 6, 8; Stem 3: leaves 1, 3. Key: 1 | 2 = 12. What is the range of the data?
- 5
The numbers of books read by students are 4, 7, 9, 10, 12, 13, 15, 18, 20, 22, and 25. Find the five-number summary.
- 6

Make a box plot from this five-number summary: minimum 12, first quartile 18, median 24, third quartile 30, maximum 36.
- 7
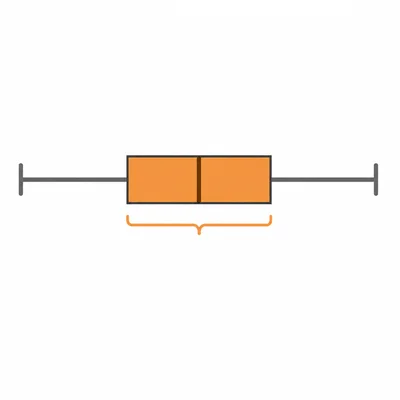
A box plot has a minimum of 15, first quartile of 22, median of 28, third quartile of 35, and maximum of 41. What is the interquartile range?
- 8

A box plot shows test times in minutes. The minimum is 20, Q1 is 30, the median is 42, Q3 is 50, and the maximum is 60. What percent of the test times are between 30 and 50 minutes?
- 9

Class A has a median score of 78 and an interquartile range of 10. Class B has a median score of 78 and an interquartile range of 22. Which class has more spread in the middle half of its scores?
- 10
Find the five-number summary for this data set: 6, 8, 10, 11, 14, 16, 18, 20.
- 11
The temperatures for one week were 68, 70, 71, 72, 74, 75, and 83 degrees. Which display would better show the exact temperatures, a stem-and-leaf plot or a box plot?
- 12
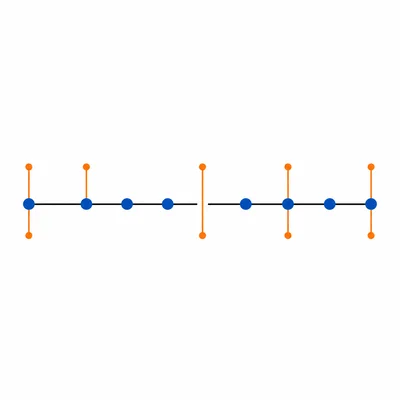
A back-to-back stem-and-leaf plot compares two teams' points in games. Team Red values are 21, 24, 26, 28, 31, 33, and 35. Team Blue values are 18, 20, 22, 23, 25, 27, and 29. Which team has the higher median score?
- 13
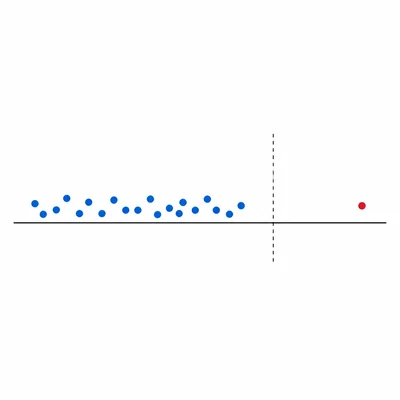
Use the 1.5 times IQR rule to check for outliers in this data set: 10, 12, 13, 15, 17, 18, 20, 45. The first quartile is 12.5 and the third quartile is 19. What value is an outlier?
- 14

A student made a box plot for the data 3, 5, 7, 8, 9, 11, 12. The student put the median line at 8 and the box from 5 to 11. Is the box correct? Explain.
- 15
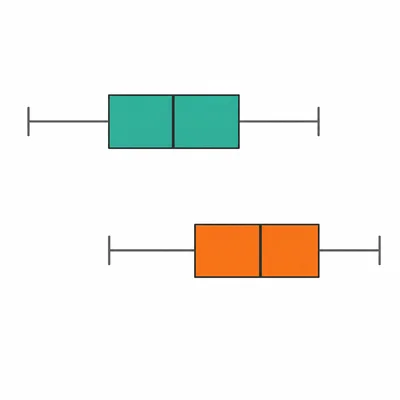
Two box plots show the number of minutes students exercised. Group X has a median of 35 minutes and an IQR of 12 minutes. Group Y has a median of 42 minutes and an IQR of 12 minutes. What can you conclude about the centers and spreads?