Practice comparing simulation model outputs with real data by identifying patterns, errors, uncertainty, assumptions, and possible model improvements.
Read each problem carefully. Compare the simulation results with the real data, and explain your reasoning using evidence.
Evaluating how well models match observations
Science - Grade 9-12
- 1
A climate simulation predicts an average July temperature of 28.4°C for a city. The measured average July temperature is 27.1°C. Calculate the model error using simulated value minus observed value, and explain what the sign of the error means.
- 2
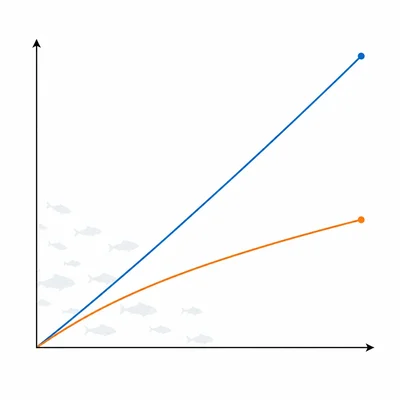
A population model predicts that a fish population will increase from 1,000 to 1,600 in five years. Field surveys show the population increased from 1,000 to 1,250. Describe one way the model matches the data and one way it does not match the data.
- 3
The table shows predicted and observed nitrate levels in a stream after a storm. Day 1: predicted 6 mg/L, observed 5 mg/L. Day 2: predicted 9 mg/L, observed 8 mg/L. Day 3: predicted 7 mg/L, observed 9 mg/L. Day 4: predicted 4 mg/L, observed 6 mg/L. On which day did the simulation have the smallest absolute error?
- 4
A disease spread simulation assumes that every person has the same number of daily contacts. Real contact tracing data show that some people have many more contacts than others. Explain how this assumption could affect the simulation results.
- 5
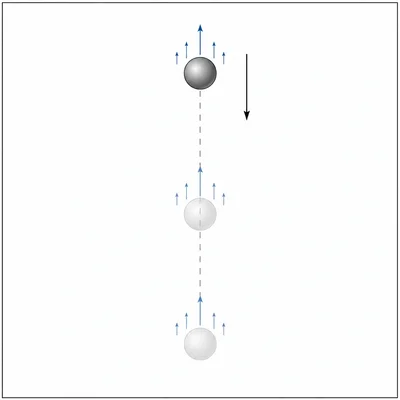
A physics simulation predicts the motion of a falling ball but ignores air resistance. In a real experiment, the measured falling time is slightly longer than the simulated falling time. Explain why the simulation and real data differ.
- 6

A model of plant growth predicts heights of 12 cm, 18 cm, 24 cm, and 30 cm over four weeks. Real measurements are 11 cm, 17 cm, 22 cm, and 27 cm. Does the model show the correct trend? Does it accurately predict the values? Explain.
- 7
A student says, "The simulation is wrong because one data point does not match the real data exactly." Explain why this statement is too strong.
- 8
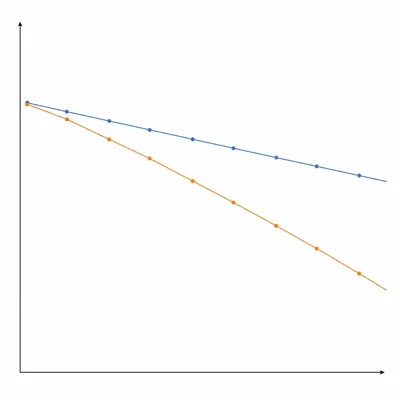
A graph compares simulated ocean pH and measured ocean pH from 2000 to 2020. Both lines decrease over time, but the simulated line decreases faster than the measured line. What does this suggest about the model?
- 9
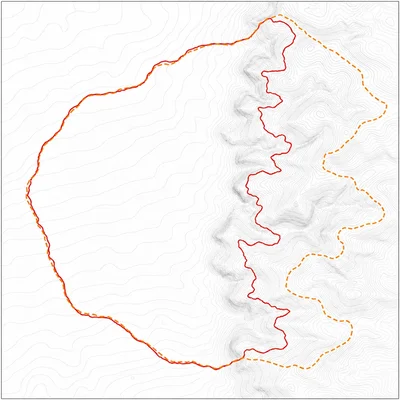
A wildfire spread simulation matches the real fire boundary well on flat land but poorly in steep terrain. Identify one likely missing or oversimplified factor in the model.
- 10
A simulation predicts that a solar panel will produce 5.2 kWh of energy on a certain day. The real panel produces 4.6 kWh. Calculate the percent error using absolute error divided by observed value times 100.
- 11
A weather model predicts a 70% chance of rain for a region, but no rain falls at one school in that region. Explain why this single observation does not necessarily prove the model failed.
- 12
A simulation of traffic flow predicts average speeds accurately during normal weekdays but poorly during a holiday weekend. What does this reveal about the limits of the model?
- 13
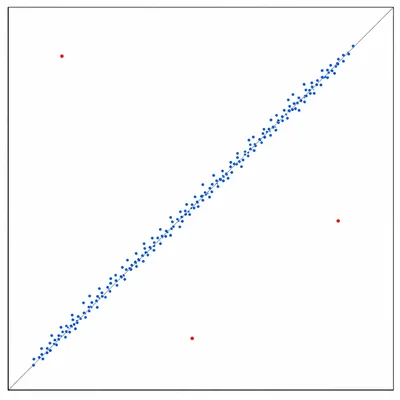
A scatter plot compares simulated values on the x-axis with observed values on the y-axis. Most points fall close to a diagonal line where simulated value equals observed value, but three points are far away. What should a scientist investigate next?
- 14
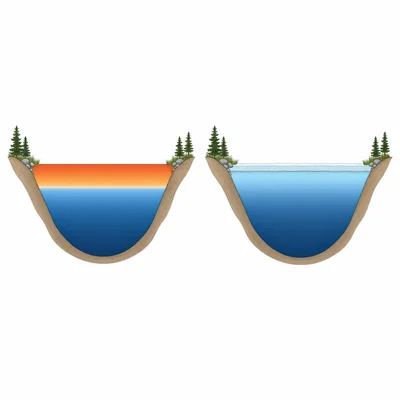
A lake temperature model was built using data from summer months only. When tested on winter data, it performs poorly. Explain why the model may not work well in winter.
- 15
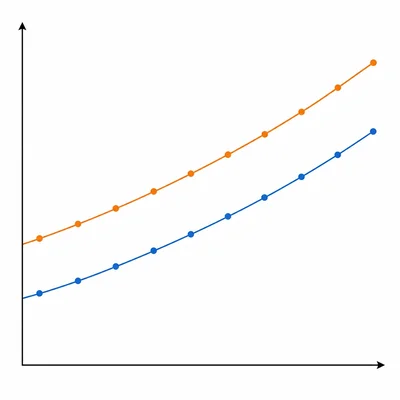
You compare a simulation with real data and find that the model consistently predicts values that are 2 units too high at every time point. Is this mainly random error or systematic bias? Explain how the model could be improved.