Epidemiology Spread Simulator
Simulate disease outbreaks with the classic SIR compartmental model. Compare your simulation to bundled snapshots of real outbreaks including COVID-19, the 2017 to 2018 flu season, Ebola, measles, and SARS. Adjust R0 and recovery rate by hand or run a grid-search fit to find the parameters that best match each curve.
Guided Experiment Fit SIR to COVID-19 Wave 1
What R0 do you predict for the original COVID-19 strain in the USA during March to August 2020?
Write your hypothesis in the Lab Report panel, then click Next.
Exponential rise through April, partial control over summer, broad July peak near 70k cases per day.
Controls
COVID-19 USA Wave 1
Model Results
Data Table
(0 rows)| # | Outbreak | R0 | Recovery Period(days) | Peak Day(d) | Peak Infectious | Total Infected | Herd Threshold(%) |
|---|
Snapshot data. Sources include WHO outbreak archives, CDC FluView, and Our World in Data COVID-19 dataset. See ourworldindata.org/coronavirus for live counts. Outbreak total of 6 reference curves bundled in this lab.
Reference Guide
The SIR Compartmental Model
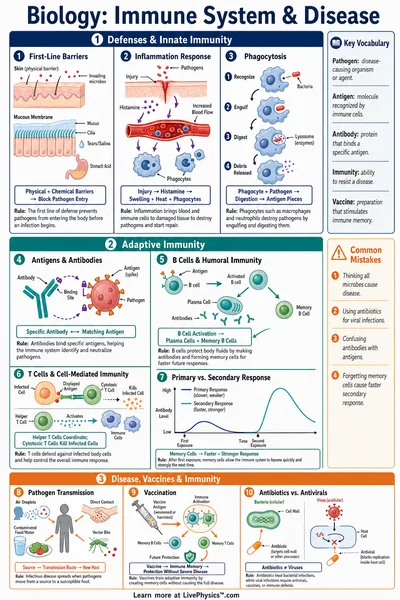
The SIR model splits a population into three groups. Susceptible (S) people can catch the disease, infectious (I) people can transmit it, and removed (R) people have recovered or died and no longer transmit.
Beta is the transmission rate, gamma is the recovery rate, and N is the total population size.
Basic Reproduction Number R0
R0 is the average number of new infections caused by one infectious person in a fully susceptible population.
If R0 is greater than 1 an epidemic grows. If R0 is less than 1 the outbreak fades. R0 depends on both the disease and the contact patterns of the population.
Effective R (Re)
As people recover or are vaccinated the susceptible pool shrinks. The effective reproduction number tracks transmission in real time.
When Re crosses below 1 new infections start to decline. Public health measures aim to push Re below 1.
Herd Immunity Threshold
The fraction of the population that must be immune for the disease to stop spreading is set by the basic reproduction number.
For measles with R0 near 15 this is about 93 percent. For flu with R0 near 1.3 it is only about 23 percent.
R0 by Disease
- Measles. R0 around 15. Herd threshold near 93 percent.
- Original COVID-19. R0 around 2.5. Herd threshold near 60 percent.
- Omicron COVID-19. R0 estimated 8 to 9. Herd threshold near 88 percent.
- SARS 2003. R0 around 2 to 3. Controlled rapidly through isolation.
- Ebola. R0 around 1.5 to 2. Spread is bumpy due to cluster transmission.
- Seasonal flu. R0 around 1.3. Short generation time and large susceptible pool.
Snapshot Data Note
The six outbreaks bundled in this lab are static snapshots synthesized to match the documented shape, timing, and peak magnitude of each event. They are designed for classroom modelling, not for current case counts.
For live data and full datasets see ourworldindata.org/coronavirus, the CDC FluView dashboard, and WHO outbreak archives.