Practice identifying variables, creating control groups, reducing bias, and planning controlled experiments that produce reliable evidence.
Read each problem carefully. Show your work in the space provided.
Planning fair tests with variables, controls, and evidence
Science - Grade 9-12
- 1
A student wants to test whether adding nitrogen fertilizer affects the height of bean plants after 4 weeks. The student grows 20 bean plants, gives half of them fertilizer, gives the other half no fertilizer, and keeps the same pot size, soil type, water amount, and light exposure. Identify the independent variable, dependent variable, control group, and at least two constants.
- 2
Write a testable hypothesis for an experiment investigating how the amount of daily sunlight affects the growth rate of tomato plants.
- 3
A researcher tests whether caffeine affects reaction time. One group drinks coffee with caffeine, and another group drinks coffee without caffeine that tastes the same. Explain why the decaffeinated coffee group is needed.
- 4
A student tests whether music helps people memorize vocabulary words. The music group studies in a quiet classroom, while the no-music group studies in a noisy hallway. Identify the problem with this design and explain how to fix it.
- 5
In an enzyme experiment, a student tests the effect of temperature on reaction rate using only one trial at 20 degrees Celsius, one trial at 30 degrees Celsius, and one trial at 40 degrees Celsius. Explain why this design is weak and how to improve it.
- 6
A scientist is testing a new plant hormone on 100 seedlings. Explain why randomly assigning seedlings to the treatment group and control group improves the experiment.
- 7
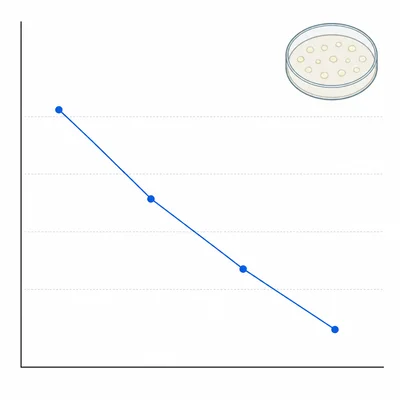
A student records the following average bacterial colony counts after applying different amounts of disinfectant: 0 mL: 120 colonies, 1 mL: 75 colonies, 2 mL: 40 colonies, 3 mL: 18 colonies. Identify the independent variable, dependent variable, and the best graph type for displaying the data.
- 8
A drug company tests a new allergy medicine. Some participants receive the medicine, and others receive a sugar pill that looks identical. Neither the participants nor the doctors collecting the data know who received which pill. Name and explain the two design features used here.
- 9
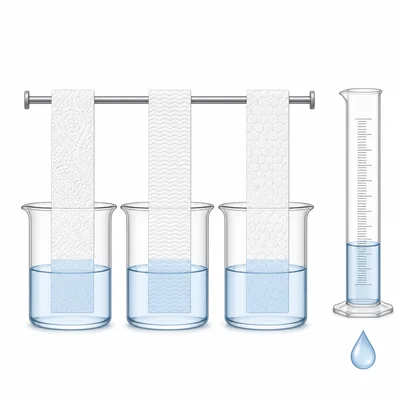
Design a controlled experiment to test which of three paper towel brands absorbs the most water. Include the independent variable, dependent variable, control variables, and a basic procedure.
- 10
A class concludes that a fertilizer makes plants grow taller because the fertilized plants averaged 16 cm tall and the unfertilized plants averaged 15.5 cm tall after 3 weeks. The experiment had only two plants in each group. Explain why the conclusion should be cautious.
- 11
A biologist observes that birds visit feeders more often on cold days than warm days. Explain why this observation alone does not prove that cold temperature causes more feeder visits, and describe a controlled experiment that could test the relationship.
- 12
A student wants to test whether more light increases algae growth in aquariums. List four variables that should be kept constant.
- 13
A student wants to test whether sleep affects test scores by asking classmates to sleep only 3 hours before a test. Explain the ethical problem and suggest a safer alternative design.
- 14
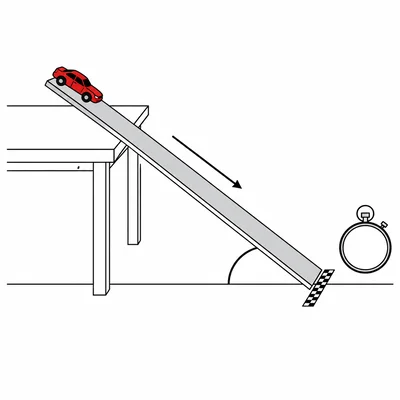
Write a short procedure for testing how ramp angle affects the speed of a toy car. Include how you would measure the dependent variable and at least three variables you would control.
- 15
An experiment comparing two water filters reports the results from one test only. Filter A removed 92 percent of particles, and Filter B removed 89 percent. Explain what additional evidence would make the claim that Filter A is better more reliable.