Understanding Calorimetry Virtual Experiment Lab
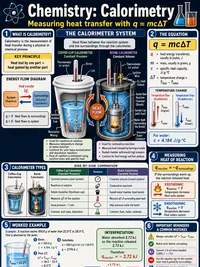
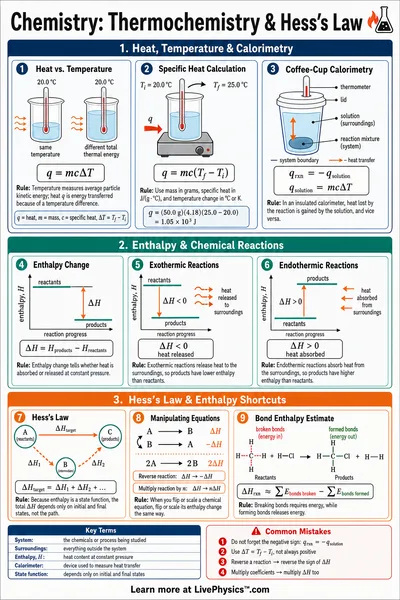
Calorimetry works because energy does not disappear when substances at different temperatures are brought together. Heat flows from the warmer part of the system to the cooler part until they reach one final temperature.
In a well designed experiment, the heat lost by one part nearly matches the heat gained by the other parts. The word nearly matters because the cup, thermometer, stirrer, and surrounding air can take in or release energy too.
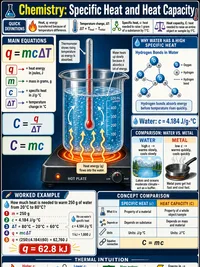
A specific heat experiment depends on comparing temperature change with the energy transferred. A material with a high specific heat needs more energy to warm by the same amount than a material with a low specific heat.
Water is often used as a reference because its specific heat is well known. Students should notice that a small temperature change can make the final calculation less reliable, since the thermometer uncertainty becomes a larger fraction of the measured result.
The calorimeter itself is not just a container. Its walls and equipment absorb heat, so its heat capacity must be measured or estimated before precise work can be done.
Mixing measured amounts of warm and cool water provides a practical way to find this value. If the calculated calorimeter heat capacity changes greatly from trial to trial, the setup may have poor insulation, inconsistent stirring, or inaccurate starting temperatures.
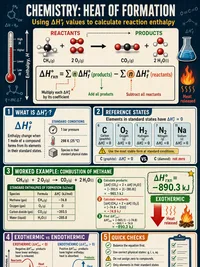
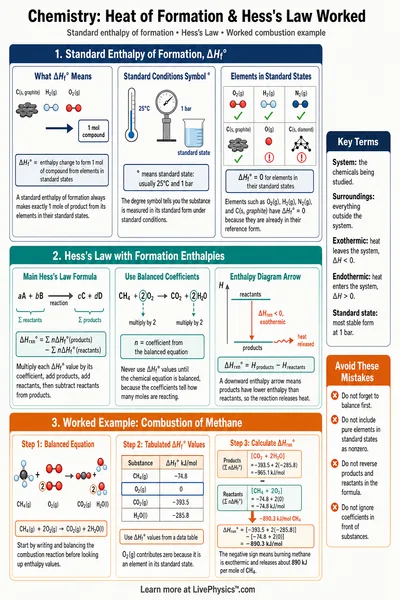
Combustion calorimetry connects temperature measurements to chemical energy stored in fuel. When a fuel burns, chemical bonds change and energy is released as heat.
Dividing the measured heat release by the amount of fuel burned gives an energy value per mole. A bomb calorimeter is sealed and rigid, which makes it useful for combustion, while a coffee cup calorimeter is usually open to the air and better suited to reactions in solution.
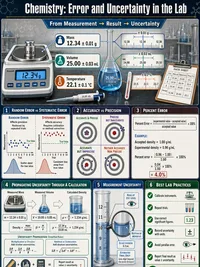
Repeated trials reveal more than one result ever can. A cluster of similar values suggests random variation, while results that are all too high or all too low point to a systematic problem. A graph and fitted line can show whether the expected relationship is actually supported by the measurements.
Residuals show how far individual points lie from that line, and propagated uncertainty tracks how limits in mass, temperature, and calibration affect the final answer. Percent error compares the experimental value with an accepted value, but students should explain the physical reason for disagreement instead of treating the percentage as the whole conclusion.