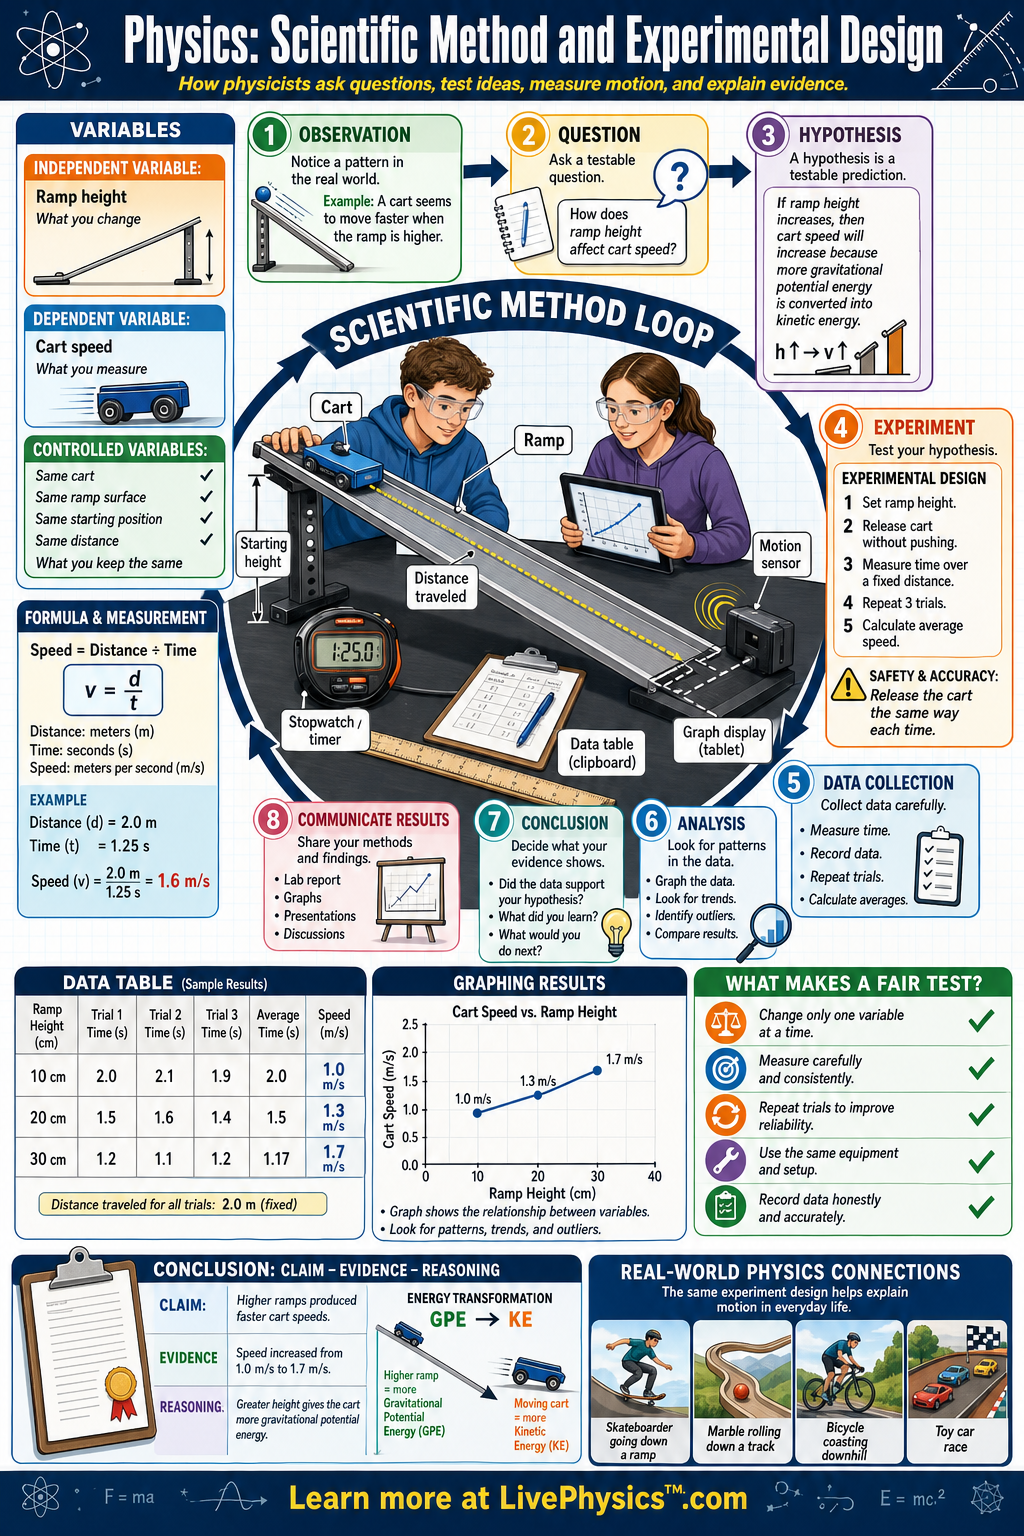
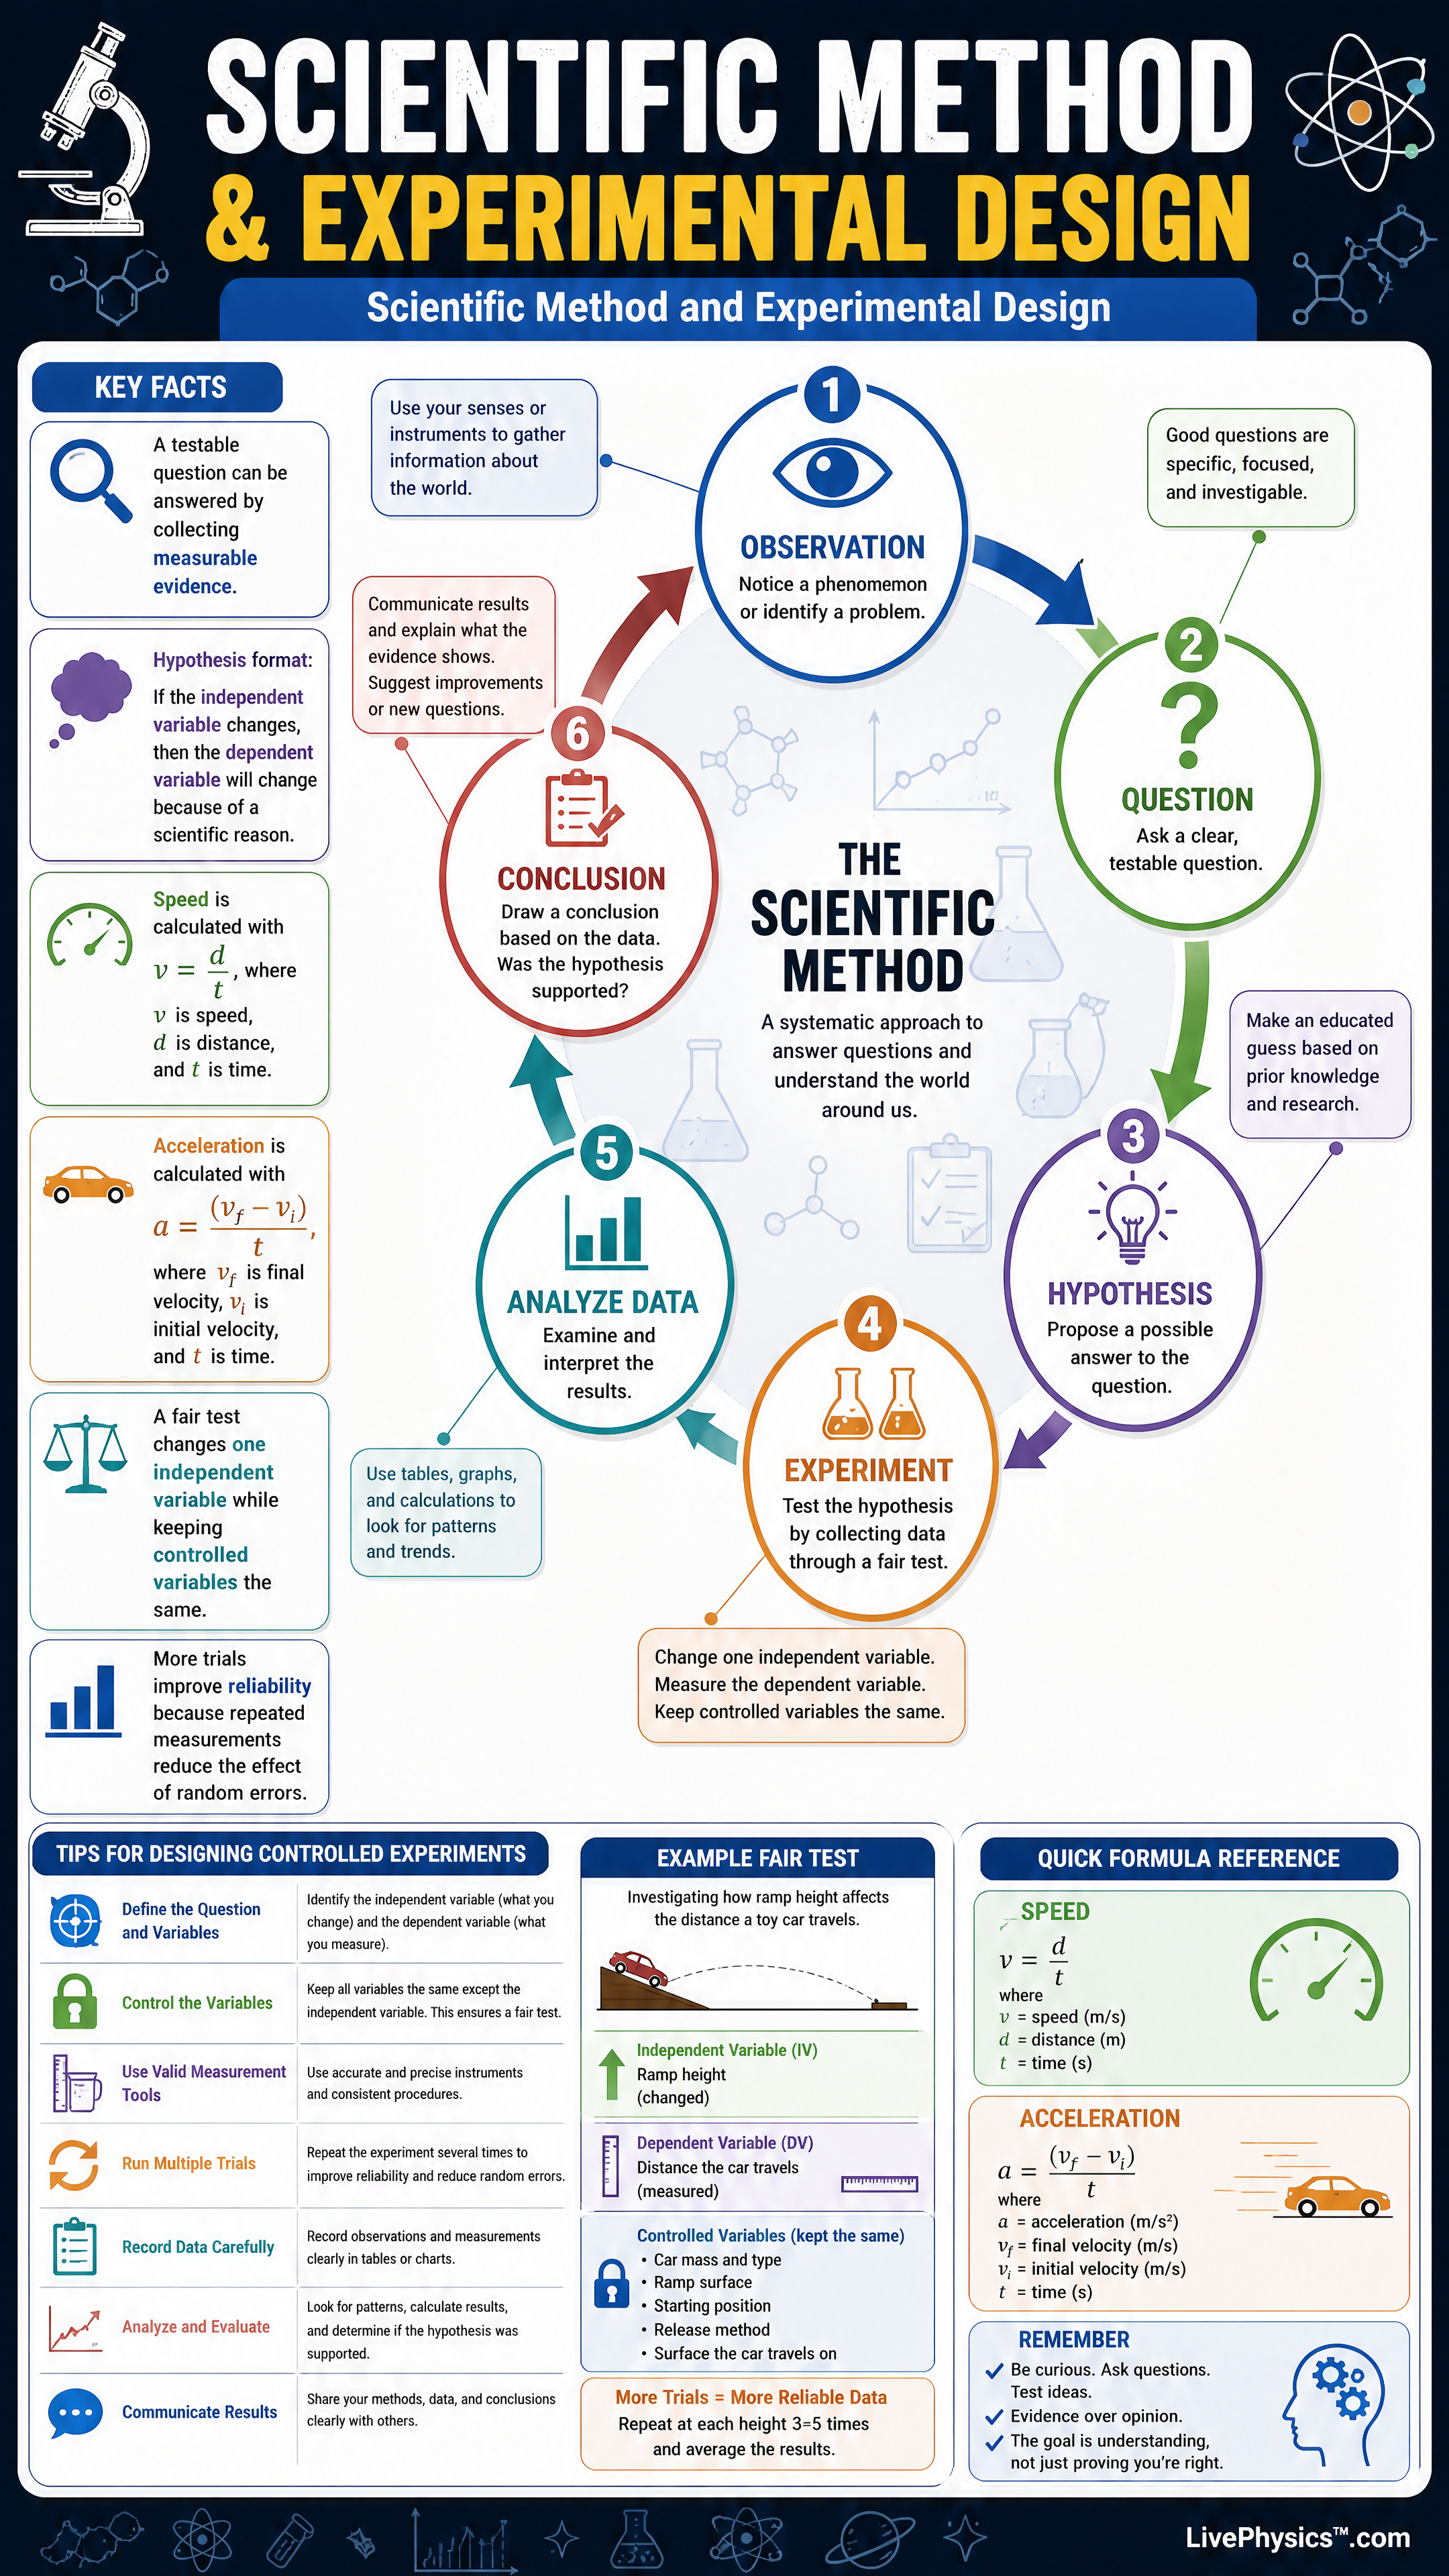
Physics experiments help us turn observations into evidence-based explanations. In a rolling cart ramp experiment, students can measure how distance, time, speed, and acceleration are related. The scientific method gives a clear loop for asking questions, testing ideas, analyzing data, and improving the experiment.
This matters because good experimental design helps separate real patterns from guesses, bias, or random error.
A strong physics investigation starts with a testable question and a hypothesis that predicts what will happen. The experiment should change only one independent variable, measure one dependent variable, and keep other conditions controlled. Repeated trials, careful measurements, and graphs make the results more reliable.
By comparing data to a model, students can decide whether the evidence supports the hypothesis or points to a better explanation.
Understanding Scientific Method & Experimental Design
Experimental design begins by turning broad ideas into quantities that can be measured the same way each time. This is called an operational definition. For example, "time taken" might mean the reading from a stopwatch between the instant a cart is released and the instant its front reaches a tape line.
Without this definition, two students may collect different kinds of data while using the same words. Units matter too. Record distance in metres or centimetres, time in seconds, and mass in kilograms.
A data table should be prepared before the experiment starts. It needs headings, units, and enough space for every trial. This simple planning prevents missing information later.
Controls are more than a list written in a report. They protect the comparison being made. In an investigation of ramp angle, the cart, track surface, release point, timing method, and measured travel distance should remain fixed.
If the cart gets a push in one trial but not another, the result no longer shows the effect of angle alone. A control condition can provide a useful baseline. For instance, a nearly level ramp helps show what happens when the slope is very small.
Some variables are difficult to hold perfectly constant. Students should identify these limits honestly. Temperature, friction, battery level in sensors, or a slightly different release can affect results.
Every measurement has uncertainty. A ruler may be marked only to the nearest millimetre. A hand stopwatch has extra uncertainty because a person reacts late when starting or stopping it.
This does not mean the experiment has failed. It means conclusions must match the quality of the evidence. Electronic timers can reduce reaction time effects, but they still need checking.
Calibration means comparing an instrument with a known standard or confirming that its zero point is correct. Random errors make readings scatter in different directions.
Systematic errors shift many readings in one direction, such as a stopwatch that consistently runs slow. Repeating trials helps reveal scatter, but it does not automatically remove a systematic error.
Graphs help students see patterns that individual numbers can hide. Put the variable deliberately changed on the horizontal axis and the measured response on the vertical axis. Use even scales, clear labels, and units.
A best fit line shows the overall trend without forcing every point onto a line. Points far from the pattern deserve attention. They may be genuine results, recording mistakes, or signs that a control was not maintained.
Do not delete an unusual value simply because it looks inconvenient. Check the procedure, repeat that trial if possible, and explain the decision.
A conclusion should state what the data show, describe the strength of the pattern, and name limits in the method. Evidence can support an explanation while still leaving room for a better experiment.
Key Facts
- A testable question can be answered by collecting measurable evidence.
- Hypothesis format, If the independent variable changes, then the dependent variable will change because of a scientific reason.
- Speed is calculated with v = d/t, where v is speed, d is distance, and t is time.
- Acceleration is calculated with a = (vf - vi)/t, where vf is final velocity and vi is initial velocity.
- A fair test changes one independent variable while keeping controlled variables the same.
- More trials improve reliability because repeated measurements reduce the effect of random errors.
Vocabulary
- Independent variable
- The independent variable is the factor that the experimenter changes on purpose to test its effect.
- Dependent variable
- The dependent variable is the factor that is measured or observed in response to the independent variable.
- Controlled variable
- A controlled variable is a factor kept the same so the test is fair.
- Hypothesis
- A hypothesis is a testable prediction that explains what you think will happen and why.
- Reliability
- Reliability means that repeated trials give similar results under the same conditions.
Common Mistakes to Avoid
- Changing more than one variable at a time is wrong because you cannot tell which change caused the result.
- Using only one trial is weak because a single measurement may be affected by timing mistakes, equipment errors, or random variation.
- Writing a vague hypothesis is unhelpful because a good hypothesis must name the variables and make a clear prediction.
- Graphing data without labels or units is incorrect because readers need to know what each axis represents and how measurements were made.
Practice Questions
- 1 A cart travels 2.4 m down a ramp in 1.6 s. Calculate its average speed using v = d/t.
- 2 A cart starts from rest and reaches 3.0 m/s after 2.5 s. Calculate its acceleration using a = (vf - vi)/t.
- 3 A student wants to test how ramp height affects the speed of a cart. Identify the independent variable, the dependent variable, and two controlled variables.