Practice AP Microeconomics concepts related to market structures, monopoly pricing, barriers to entry, regulation, and efficiency.
Read each problem carefully. Show your work and explain your reasoning using AP Microeconomics vocabulary.
Analyzing firm behavior, market power, and monopoly outcomes
Social Studies - Grade 9-12
- 1
List the four main market structures studied in AP Microeconomics and identify one key characteristic of each.
- 2
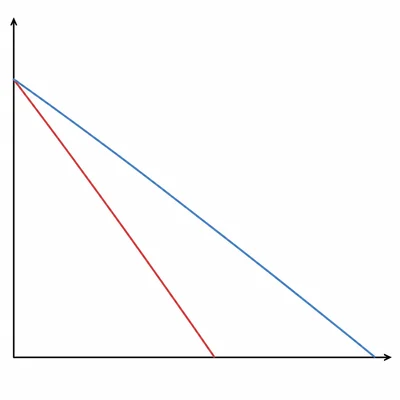
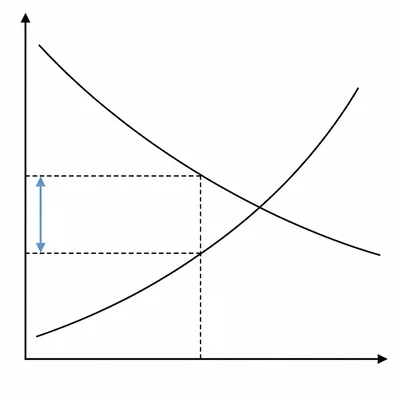
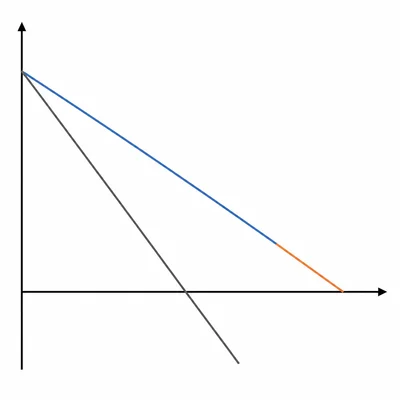
A monopolist faces a downward-sloping demand curve. Explain why its marginal revenue curve lies below its demand curve.
- 3
A monopolist's marginal cost is $12 and its marginal revenue is $15 at the current output level. Should the firm increase, decrease, or keep the same level of output? Explain.
- 4
At the profit-maximizing output, a monopolist charges $25 per unit and has an average total cost of $18 per unit. If it sells 1,000 units, calculate its total profit.
- 5
Describe two common barriers to entry that can allow a monopoly to exist.
- 6
A patent gives a company the exclusive right to sell a new medicine for a period of time. Explain how this can create temporary monopoly power and why society might allow it.
- 7
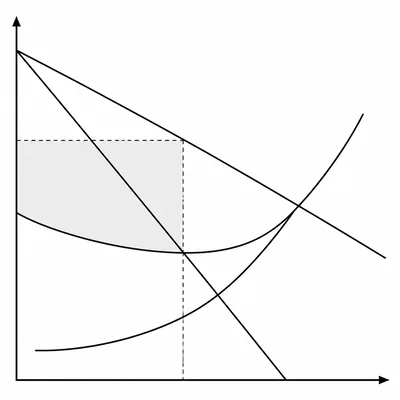
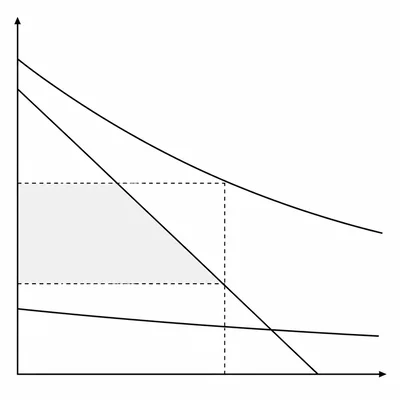
Use the monopoly graph idea to explain how a monopolist chooses price and quantity.
- 8
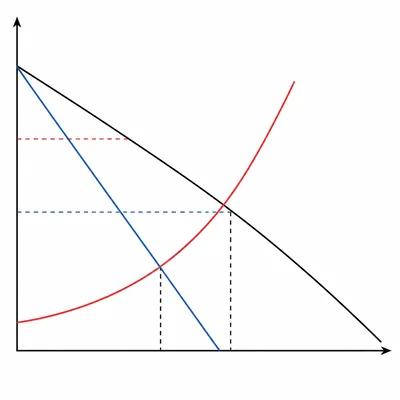
Why does a single-price monopolist usually produce less and charge a higher price than a perfectly competitive industry with the same costs?
- 9
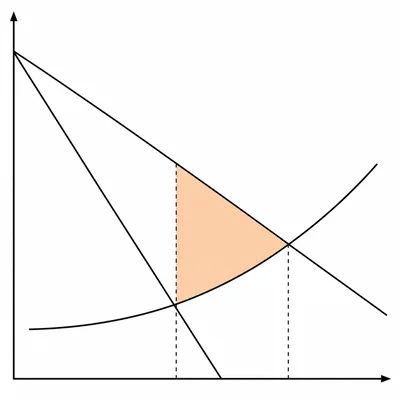
Define deadweight loss in a monopoly market and explain why it occurs.
- 10
A monopolist charges a price of $40 and has a marginal cost of $20 at the profit-maximizing quantity. Explain what this tells us about allocative efficiency.
- 11
Explain why a monopolist will not choose to produce on the inelastic portion of its demand curve.
- 12
What is price discrimination? Give one real-world example and explain how it can increase a firm's profit.
- 13
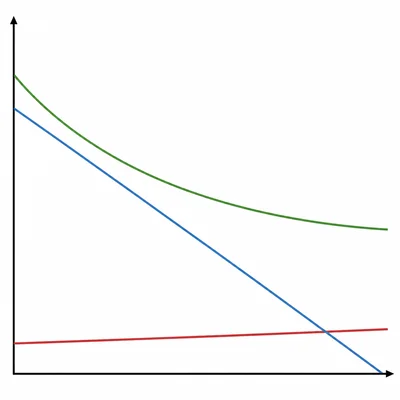
A natural monopoly has very high fixed costs and low marginal costs. Explain why one large firm may be more efficient than several smaller firms in this market.
- 14
A government sets a price ceiling on a natural monopoly equal to marginal cost. Explain one benefit and one possible problem with this policy.
- 15
Compare monopoly and monopolistic competition in the long run. Include product differentiation, barriers to entry, and economic profit.