Worksheet Generator
Generate a printable practice worksheet in seconds. Choose your subject, topic category, grade band, and difficulty. Download a PDF with name and date fields and an optional answer key, or copy the questions as plain text. All generation happens in your browser, with no account needed.
Build Your Worksheet
51530
Difficulty
Worksheet Style
Worksheet - Multiplication and Division
Math | Elementary | Easy
Name
Date
- 1.There are 4 bags with 6 apples each. How many apples total?
- 2.10 - 4 = ___
- 3.5/6 + 1/6 = ___
- 4.Maya has 3 stickers. She gets 7 more. How many stickers does she have now?
- 5.Find the perimeter of a rectangle with length 7 and width 7.
- 6.7 + 8 = ___
- 7.1.5 + 8.1 = ___
- 8.9 × 4 = ___
- 9.What is 100% of 20?
- 10.20 ÷ 5 = ___
Answer Key
Math | Multiplication and Division | Elementary | Easy
- 1.24 apples
- 2.6
- 3.1
- 4.10 stickers
- 5.28 units
- 6.15
- 7.9.6
- 8.36
- 9.20
- 10.4
Best Practices for Practice Worksheets
When to Use a Practice Worksheet
- Skill drill. Reinforce a concept students just saw in a mini-lesson with five to fifteen quick problems.
- Bell-ringer or warm-up. A short worksheet primes students for the day's learning and surfaces gaps.
- Substitute folder. Generate a printable packet that any sub can hand out cold.
- Homework or station work. Mix difficulty bands across rotations so every student has the right level.
Differentiation Tips
- Three-tier rotation. Generate the same topic at Easy, Medium, and Hard. Hand each student the version that matches their current level.
- Use show-work spaces. The show-work style gives students room to draft and self-check before writing a final answer.
- Two-column for warm-ups. The two-column layout fits more questions on one page and works well for fluency drills.
- Boxed-answer for fast grading. Tell students to write only the final answer in the box so you can grade a stack quickly.
Answer Keys and Self-Checking
- Toggle the answer key on to print a teacher copy on page two of the PDF.
- Same seed plus same settings always produces the same worksheet, so the answer key matches every student's copy.
- Keep the answer key off when handing out to students, then flip it back on for your own copy.
- Use the share link to lock in a specific worksheet across classes or revisit it next year.
Classroom Routines
- Five-minute warm-up. Generate ten easy problems on yesterday's topic. Students do them silently, then partner-check.
- Tiered rotations. Print Easy, Medium, and Hard versions and assign by data from the last formative.
- Reteach fast. When most of the class missed a concept, regenerate a short worksheet on that exact topic for the next day.
- Digital fallback. Use copy as text to paste questions into a quiz platform when printing is not an option.
- Substitute pack. Build five worksheets at the start of the unit and keep PDFs in your sub folder.
Related Content
Visual Explainers
Why Do Fractions Feel Hard?
Because fractions ask numbers to do a new job
Why Are Some Decimals Endless but Others Stop?
How fractions turn into decimal patterns
How Does Compound Interest Grow So Fast?
Exponential growth from interest on interest
Why Do Negative Numbers Make Sense?
Numbers below zero describe real opposites
Related Tools
Compound Interest Calculator
Compute A = P(1+r/n)^(nt) with various compounding frequencies, monthly contributions, growth chart, year-by-year table, and Rule of 72.
Unit Converter
Convert across 10 categories, length, mass, volume, temperature, speed, area, energy, pressure, time, and data. See all conversions at once.
Loan & Mortgage Amortization Calculator
Calculate monthly payments, total interest, and generate a full amortization schedule. See the impact of extra payments with principal vs interest charts.
Experimental Data & Uncertainty Analyzer
Enter experimental data (x, y pairs) or paste CSV, perform linear regression with R-squared, standard errors, and residual analysis. Propagate uncertainties through addition, multiplication, division, and power operations. Calculate percent error with significant figures. SVG scatter plot with best-fit line and error bars.
Related Labs
Decision Trees & Risk Analysis Lab
Build decision trees with chance and decision nodes. Compute expected values by folding back from outcomes, find the optimal strategy, and run sensitivity analysis on probabilities
Wealth Growth Lab
Simulate wealth accumulation over 30+ years with employer matching, fees, and inflation. Compare early vs late start and low-fee vs high-fee investment strategies
Consumer Credit Lab
Compare borrowing costs at different APRs and terms. Test avalanche vs snowball payoff strategies on multiple debts. See the true cost of credit card minimum payments
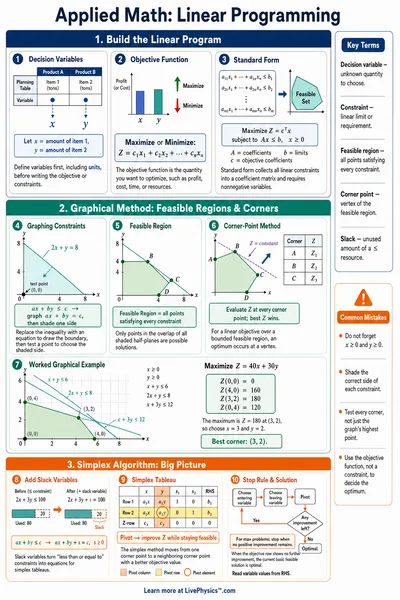
Linear Programming Lab
Solve real-world optimization problems (factory production, meal planning, shipping) using the graphical method. Find feasible regions, evaluate corner points, and explore sensitivity