Practice interpreting GIS data, map layers, scale, remote sensing, and modern mapping tools used in social studies and civic decision-making.
Read each problem carefully. Use evidence from the map description, data, or scenario. Show your work or explain your reasoning in the space provided.
Using spatial data to understand people, places, and patterns
Social Studies - Grade 9-12
- 1
A city planner uses GIS to decide where to build a new public library. Name three map layers that would help the planner make a fair and useful decision, and explain why each layer matters.
- 2
A GIS map shows flood zones, school locations, and household income by census tract. Explain how this map could help local government improve disaster planning.
- 3
Define geocoding in your own words and give one example of how it might be used in social studies research.
- 4
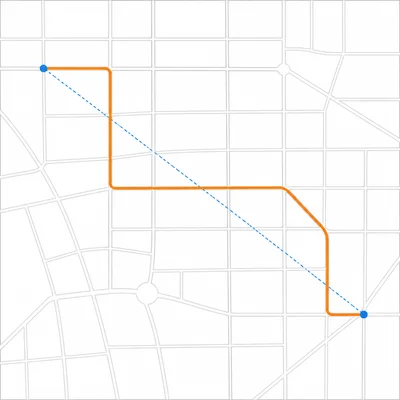
A map app shows a grocery store as 2 miles away in a straight line, but the driving route is 3.4 miles. Explain why the two distances are different and which one is more useful for planning a trip.
- 5
Study this situation: A county overlays three GIS layers: locations of medical clinics, areas with high numbers of older adults, and areas more than 30 minutes from a hospital. What pattern should officials look for, and what action might they take?
- 6
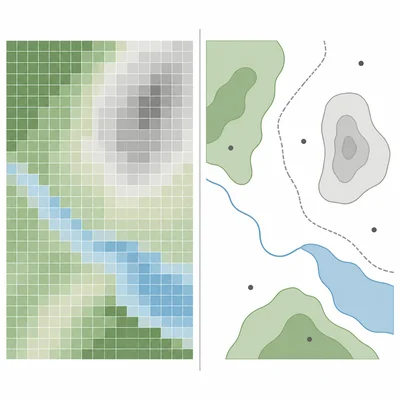
Explain the difference between a raster data layer and a vector data layer in GIS. Give one example of each.
- 7
A student makes a map of internet access by neighborhood. The map uses darker colors for higher percentages of households with broadband. What type of thematic map is this, and what is one caution when interpreting it?
- 8
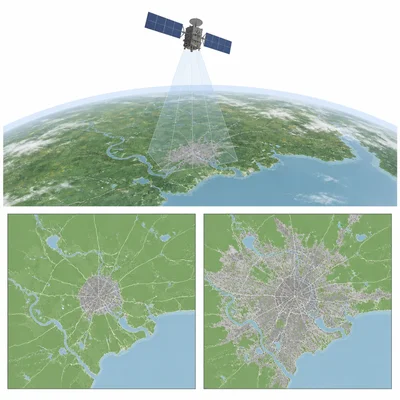
Remote sensing often uses satellites or aircraft to collect data. Describe one way remote sensing could help researchers study urban growth over time.
- 9
A GIS analyst is mapping crime incidents in a city. Explain why it is important to protect privacy when displaying this data, and describe one method the analyst could use.
- 10
A map scale says 1 inch equals 5 miles. Two parks are 3.5 inches apart on the map. Calculate the real-world distance between the parks and explain your calculation.