Practice interpreting key ideas in population geography and demographics, including population density, migration, birth and death rates, age structure, and demographic transition.
Read each problem carefully. Show your reasoning and use complete sentences when asked to explain.
Exploring population patterns, change, and distribution
Social Studies - Grade 9-12
- 1
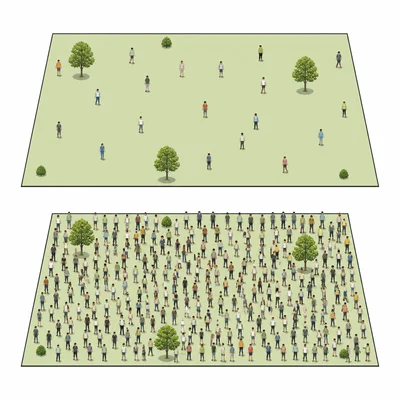
Define population density and explain what it tells geographers about a place.
- 2
A country has 12 million people living in 300,000 square kilometers. Calculate its population density.
- 3
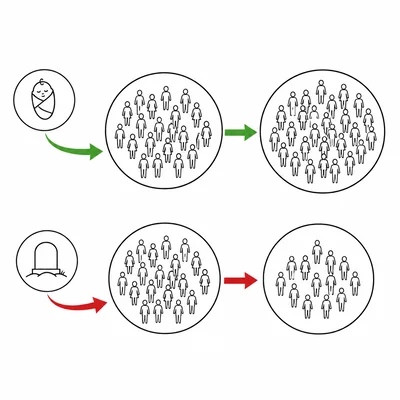
Explain the difference between birth rate, death rate, and rate of natural increase.
- 4
A region has a birth rate of 18 per 1,000 and a death rate of 7 per 1,000. What is the rate of natural increase?
- 5
Describe one push factor and one pull factor that can influence migration.
- 6
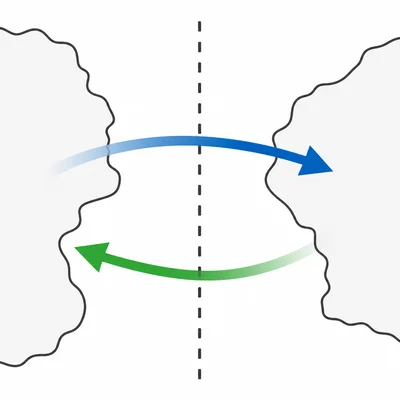
What is the difference between immigration and emigration?
- 7
A city has 500,000 residents at the start of the year. During the year, 20,000 people move in and 8,000 move out. What is the net migration for the city?
- 8
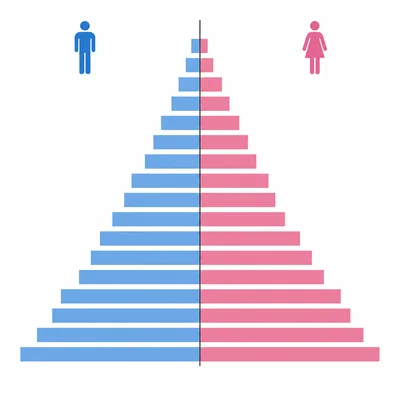
Why do many geographers use population pyramids when studying a country?
- 9
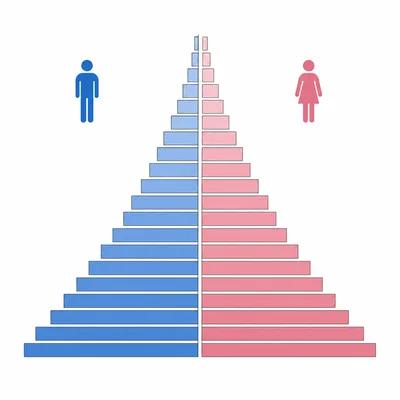
A population pyramid has a very wide base and a narrow top. What does this usually suggest about the population?
- 10
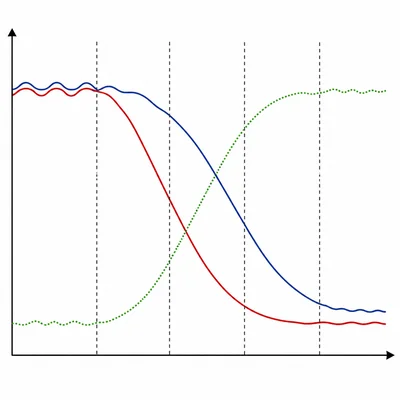
What is the demographic transition model, and what does it help explain?
- 11
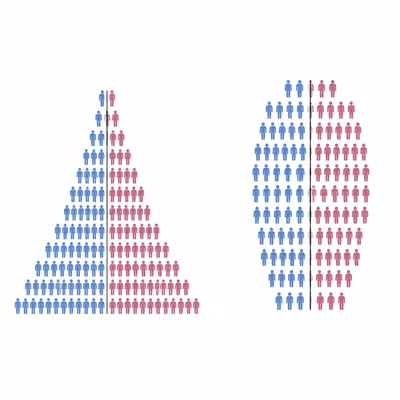
Compare a country in an early stage of the demographic transition model with a country in a later stage.
- 12
Explain how access to health care and education can affect demographic patterns in a country.