Population Density Heatmap
Visualize how 8 billion people are distributed across Earth. Switch between five overlays to compare population density with elevation zones, climate regions, tectonic plates, and economic output. Hover any country to see all its metrics at once.
Hover over a country
Reference Guide
Population Distribution
World population is highly uneven. South Asia and East Asia alone account for more than half of all humans on Earth. Bangladesh exceeds 1,200 people per square kilometer, while Canada and Australia average fewer than 5.
Key drivers of dense settlement include fertile river valleys and deltas (Ganges, Nile, Yangtze), temperate climates with reliable rainfall, flat land suitable for agriculture, and coastal access for trade.
- Asia holds about 60% of the global population
- Europe averages roughly 75 people per km²
- Africa's population is growing fastest of any continent
- Vast interior regions (Sahara, Siberia, Amazon) are nearly empty
Elevation and Terrain
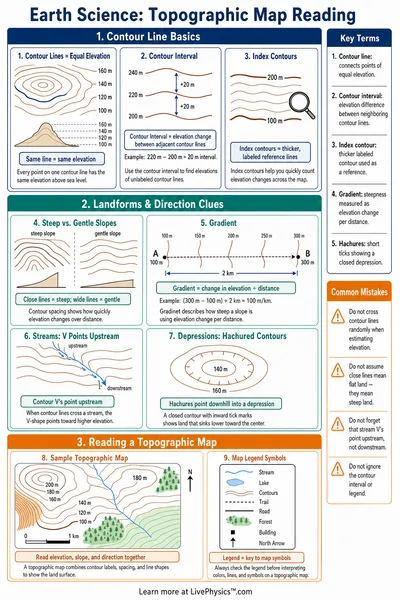
Elevation profoundly shapes where people live. Lowlands and river plains (below 200m) concentrate most of the world's population because flat land is easier to farm, build on, and connect with roads and waterways.
High plateaus like the Tibetan Plateau, Ethiopian Highlands, and Andean Altiplano do support substantial populations through adapted agriculture, but at much lower densities. Alpine zones above 3,000m remain sparsely inhabited.
- Most megacities sit below 200m elevation
- High altitude reduces oxygen and crop yields
- Mountain ranges often form natural political borders
- River deltas are both fertile and flood-prone
Climate Zones
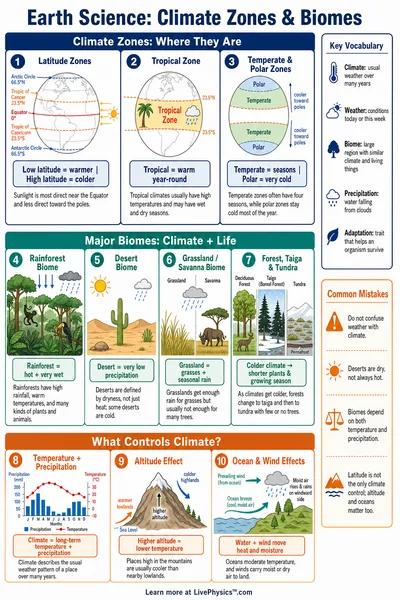
Climate is one of the strongest predictors of population density. Temperate and tropical climates with moderate to high rainfall support dense agriculture. Arid zones (Sahara, Arabian Peninsula, Australian Outback) enforce strict limits on settlement.
The Koppen climate classification groups Earth into five major types. This tool uses a simplified six-class scheme: tropical, arid, semi-arid, temperate, continental, and polar.
- Tropical zones support year-round farming but risk disease
- Arid regions cover about one-third of Earth's land surface
- Temperate climates host most of Europe and eastern North America
- Continental interiors experience extreme temperature swings
Economic Geography
GDP per capita reveals stark global inequalities. High-income countries in Western Europe, North America, and East Asia (Japan, South Korea) exceed $40,000 per person. Least-developed countries in sub-Saharan Africa and South Asia often fall below $1,000.
Wealth does not always correlate with population density. Resource-rich nations like Norway, Australia, and Saudi Arabia achieve high GDP with low or moderate density. Dense but low-income countries like Bangladesh illustrate how development lags behind demographic pressure.
- Norway ($82,500/capita) is one of the world's richest nations
- Switzerland ($87,000) leads with a small, mountainous territory
- DR Congo ($500) is among the lowest despite vast natural resources
- China's rapid growth lifted it from $300 to $12,700 in 40 years